
VIX Positioning: It’s Different This Time
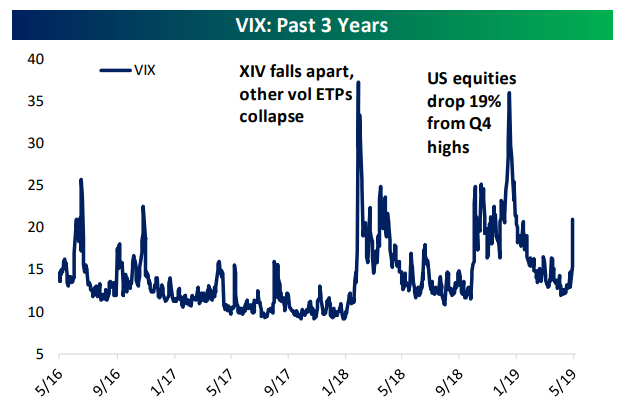
With the drop in stock prices over the last few days, equity markets have fallen and the VIX index – a measure of volatility implied by short-term options on S&P 500 stocks – has surged, as it typically does when the market drops. As shown in the chart below, this is the third time the VIX has surged over the last 18 months, with the first being a huge uptick relative to a more modest equity price decline than the huge drop in Q4. That first spike was driven by a collapse of products designed to profit from low or falling volatility.
(Click on image to enlarge)
Similar to the last drop, speculators in volatility futures have built up large short positions in volatility recently. Of the outstanding open interest in VIX-linked futures, about 40% is net short exposure for traders classified as speculators in the CFTC’s Commitment of Traders report. Are we due for another stratospheric move in the VIX as weak hands are shaken out of VIX future shorts?
(Click on image to enlarge)

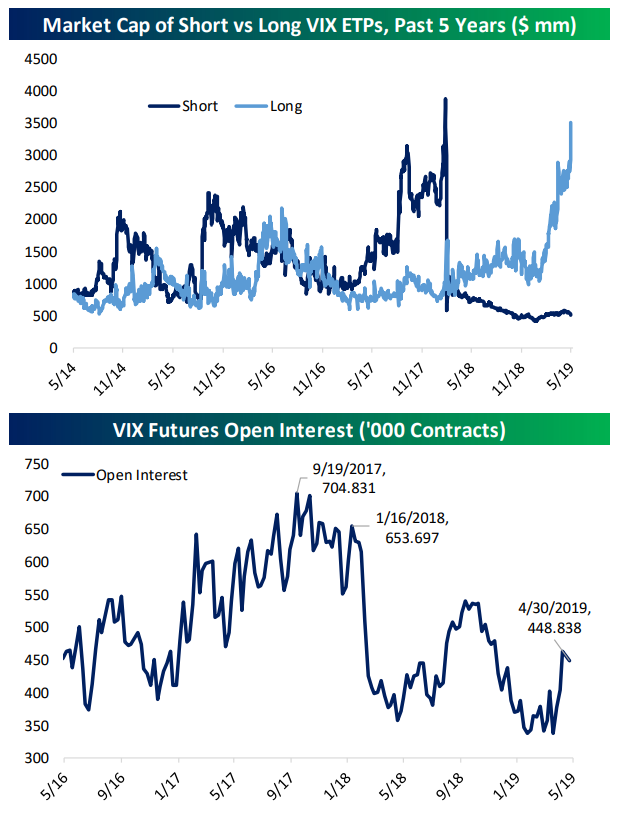
While a further rise in implied volatility isn’t something we can rule out, this time does look pretty different from the early 2018 volatility market blow-up. First of all, exchange-traded products (ETPs) that are exposed to the VIX are very long volatility. In 2017, a huge short position had built up via these ETPs, with a VIX short market cap of almost $4bn. At the time, long volatility ETPs had a combined market cap of less than $1bn. Now, the market cap imbalance is completely reversed: short vol products have only about $500mm in market cap while long vol products are north of $3.5bn. So retail traders – the primary customer base for this type of product – are positioned in the opposite manner. Furthermore, total VIX futures exposure has fallen dramatically. Back in September of 2017, there were more than 704,000 VIX futures open, with more than 650,000 outstanding in mid-January of 2018. Today, that number is 36% below the peak and 31% below where things stood in January of 2018. So not only are retail traders positioned the opposite way, total market size and therefore exposure to the VIX has dropped considerably.
(Click on image to enlarge)
Disclaimer: To begin receiving both our technical and fundamental analysis of the natural gas market on a daily basis, and view our various models breaking down weather by natural gas demand ...
more

