
VaR Estimation: Condition Shortfall

Highlights
- VaR does not provide insight into what losses might occur if the situation gets worse than the threshold that we assume.
- The Expected Shortfall method enables us to estimate the amount of tail risk an investment portfolio has.
- The I Know First AI algorithm provides us with the tool to select the most promising stocks.
Risk and return are, effectively, two sides of the same coin. Higher risks correlate with stronger potential returns while lower returns correlate with safer (lower risk) investments. Volatility is the most popular measure of risk. However, volatility does not take into account the direction of a stock movement. A stock may be volatile even if it suddenly jumps higher which could not create stress for an investor. At the same time, Value at Risk determines the potential for loss in the portfolio being assessed and the probability that the defined loss will occur. In our previous article, we have estimated the VaR of the equal-weighted portfolio by the Variance-Covariance (VCV VaR) and Historical Simulation (HS VaR) methods. However, one of the most notable limitations of the original VaR is that VaR accounts only for a certain percentile of losses and does not provide any insight at all into what losses might occur if the situation gets even worse than the threshold that we assume (if we fall further down the left tail of the distribution). At the same time, the Conditional Value at Risk (CVaR) or Expected Shortfall method enables us to estimate the amount of tail risk an investment portfolio has. For instance, if VaR is equal to 3% at 95% of the confidence interval, it means that there is a 5% chance of losing 3% or more of our portfolio value on a given day. However, if CVaR is equal to 3% at 95% of the confidence interval, it means that in the worst of 5% scenarios our average loss will be 3% a given day. Therefore, CVaR gives us an average expected loss, while VaR gives us a range of potential losses.

(Figure 1: Conditional Value at Risk)
According to Figure 1, if we have a function that generates VaR for a particular confidence interval x, then we can calculate CVaR by averaging over all the potential values of confidence intervals from 0 (the extreme absolute worst-case scenario) up to α (it is our cut-off point).
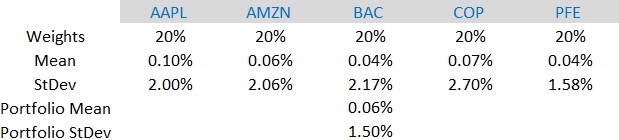
Let us estimate the CVaR of the equal-weighted portfolio of the following stocks: Apple Inc. (AAPL), Amazon.com, Inc. (AMZN), Bank of America Corporation (BAC), ConocoPhillips (COP), and Pfizer Inc. (PFE), and compare the result with that of the VaR estimation from our previous article. In Figure 2, we can notice the statistical description of the stocks and the equal-weighted portfolio. The parameters are calculated based on the log return of daily close prices for the period from May 22, 2017, to May 23, 2022. We can notice that the daily return of the equal-weighted portfolio is 0.06% with daily volatility of 1.50%.
CVaR, as well as VaR, can be estimated based on the normality assumption. If we assume a normal distribution of returns, then CVaR is estimated based on the Variance-Covariance VaR (VCV VaR) method, or if we want to stick with the actual empirical distribution of returns, then CVaR is estimated based on the Historical Simulation VaR (HS VaR) method. However, there are no closed-form solutions for the integral from Figure 1, neither for Variance-Covariance nor Historical Simulation approaches. However, we can approximate the integral by averaging over smaller and smaller increments. So, we can calculate VCV VaR or HS VaR at tiny intervals of the probability, for example, we can pick a very small increment of probability, like 0.1%, and then we can average over all of the VaRs that are corresponding to a smaller or equal confidence interval for which we want to calculate our expected shortfall. In Figure 3, we can notice VCV VaR, HS VaR, VCV CVaR, and HS CVaR of our equal-weighted portfolio. For example, HS CVaR at the confidence interval of 1%, which is equal to 6.47%, is calculated by averaging HS VaR for the confidence intervals from 0.1% to 1%. Also, we can increase the precision of the CVaR estimation by using a larger sample or by choosing an even smaller increment (for example, we can use an increment equal to 0.01% instead of 0.1%).
| Confidence Interval | VaR (VCV) | VaR (HS) | CVaR (VCV) | CVaR (HS) |
| 0.1% | -4.59% | -12.47% | -4.59% | -12.47% |
| 0.2% | -4.27% | -11.12% | -4.43% | -11.80% |
| 0.3% | -4.07% | -7.67% | -4.31% | -10.42% |
| 0.4% | -3.93% | -5.39% | -4.21% | -9.16% |
| 0.5% | -3.81% | -5.28% | -4.13% | -8.39% |
| 0.6% | -3.72% | -4.95% | -4.06% | -7.81% |
| 0.7% | -3.63% | -4.61% | -4.00% | -7.36% |
| 0.8% | -3.56% | -4.53% | -3.95% | -7.00% |
| 0.9% | -3.50% | -4.36% | -3.90% | -6.71% |
| 1.0% | -3.44% | -4.30% | -3.85% | -6.47% |
| 1.1% | -3.38% | -4.26% | -3.81% | -6.27% |
| 1.2% | -3.33% | -4.23% | -3.77% | -6.10% |
| 1.3% | -3.29% | -4.17% | -3.73% | -5.95% |
| 1.4% | -3.24% | -4.14% | -3.70% | -5.82% |
| 1.5% | -3.20% | -4.12% | -3.66% | -5.71% |
| 1.6% | -3.16% | -4.08% | -3.63% | -5.61% |
| 1.7% | -3.13% | -3.93% | -3.60% | -5.51% |
| 1.8% | -3.09% | -3.88% | -3.57% | -5.42% |
| 1.9% | -3.06% | -3.83% | -3.55% | -5.33% |
| 2.0% | -3.03% | -3.64% | -3.52% | -5.25% |
| 2.1% | -3.00% | -3.59% | -3.50% | -5.17% |
| 2.2% | -2.97% | -3.56% | -3.47% | -5.10% |
| 2.3% | -2.94% | -3.45% | -3.45% | -5.03% |
| 2.4% | -2.91% | -3.35% | -3.43% | -4.96% |
| 2.5% | -2.89% | -3.24% | -3.41% | -4.89% |
| 2.6% | -2.86% | -3.21% | -3.38% | -4.82% |
| 2.7% | -2.84% | -3.18% | -3.36% | -4.76% |
| 2.8% | -2.81% | -3.13% | -3.34% | -4.70% |
| 2.9% | -2.79% | -3.05% | -3.33% | -4.65% |
| 3.0% | -2.77% | -3.04% | -3.31% | -4.59% |
| 3.1% | -2.75% | -3.03% | -3.29% | -4.54% |
| 3.2% | -2.72% | -3.03% | -3.27% | -4.49% |
| 3.3% | -2.70% | -2.95% | -3.25% | -4.45% |
| 3.4% | -2.68% | -2.78% | -3.24% | -4.40% |
| 3.5% | -2.66% | -2.74% | -3.22% | -4.35% |
| 3.6% | -2.64% | -2.72% | -3.20% | -4.31% |
| 3.7% | -2.63% | -2.68% | -3.19% | -4.26% |
| 3.8% | -2.61% | -2.64% | -3.17% | -4.22% |
| 3.9% | -2.59% | -2.60% | -3.16% | -4.18% |
| 4.0% | -2.57% | -2.57% | -3.14% | -4.14% |
| 4.1% | -2.55% | -2.54% | -3.13% | -4.10% |
| 4.2% | -2.54% | -2.52% | -3.12% | -4.06% |
| 4.3% | -2.52% | -2.44% | -3.10% | -4.02% |
| 4.4% | -2.50% | -2.39% | -3.09% | -3.99% |
| 4.5% | -2.49% | -2.36% | -3.07% | -3.95% |
| 4.6% | -2.47% | -2.34% | -3.06% | -3.92% |
| 4.7% | -2.46% | -2.32% | -3.05% | -3.88% |
| 4.8% | -2.44% | -2.30% | -3.04% | -3.85% |
| 4.9% | -2.43% | -2.26% | -3.02% | -3.82% |
| 5.0% | -2.41% | -2.24% | -3.01% | -3.78% |
(Figure 3: CVaR Estimation)
According to Figure 3, we can notice that CVaRs are always higher in terms of loss than the corresponding VaRs, while VaRs only account for the cut-off, CVaRs also account for the expected loss that we expect to endure in n% of worst-case scenarios. Also, we can notice that CVaR HS is significantly higher than the respective CVaR VCV which corresponds to our assumption about the distribution kind of returns.
Stocks Selection with IKF
Conditional Value at Risk or Expected Shortfall allows us to estimate possible financial losses in different scenarios. Moreover, CVaR could be used as an additional constraint in the portfolio optimization task (for example, in this article we optimize a portfolio based on the four moments utility function). However, the question of the selection of promising stocks is at the discretion of investors, and it is where I Know First can help. I Know First provides different forecast packages based on the AI algorithm which allows us to select the most promising stocks (you can access them here). For example, below you can see the investment result of our Energy Stocks package which was recommended to our clients for the period from December 29th, 2020 to May 31th, 2022.

The investment strategy that was recommended by I Know First accumulated a return of 131.13%, which exceeded the S&P 500 return by 119.81%.
VaR Estimation: Conclusion
Value at Risk allows us to estimate possible financial losses within a portfolio over a specific time frame. However, one of the most notable limitations of the original VaR is that VaR accounts only for a certain percentile of losses and does not provide any insight at all into what losses might occur if the situation gets even worse than the threshold that we assume. At the same time, the Conditional Value at Risk or Expected Shortfall method enables us to estimate the amount of tail risk an investment portfolio has. While VaR and CVaR allow us to estimate possible financial losses in different scenarios, the I Know First AI algorithm provides us with the tool which enables us to select the most promising stocks.


