
Portfolio Construction Based On High Moment Distribution Parameters
Highlights
- Investors are differentiated according to different risk-taking levels, which leads to the existence of different portfolios taking into account investor preferences.
- The four moments utility function enables us to construct portfolios taking into account investors’ preferences about risk-aversion.
The investment process consists of two broad tasks. One task is security and market analysis, by which we select assets, and the second task is the formation of an optimal portfolio of assets. The portfolio task involves the identification of the best risk-return opportunities available from feasible investment portfolios and the choice of the best portfolio from the feasible set (in one of our previous articles, we show portfolio construction based on price ratios). Utility is one of the basic concepts in economics that represents the satisfaction or pleasure that consumers receive for consuming a product or service. According to the Rational Choice theory, consumers will strive to maximize their utility. In the context of portfolio selection, utility is a measure of relative satisfaction that an investor derives from different portfolios.
Because in the real world a stock return is not distributed normally, we assume that the utility function takes into account four distribution moments. According to the equation below, investors like a positive mean (the first moment) and a positive skewness (a potential upside), also investors dislike a risk (the second moment – variance), a negative skewness (a potential downside), and heavy tails and a high probability of extreme losses (the fourth moment – Kurtosis). Notice that in the normal distribution assumption, the skewness and the kurtosis are equal to 0 and 3, respectively.
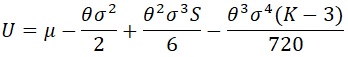
(Figure 1: The Utility Function)
The term risk-averse describes an investor who chooses the preservation of capital over the potential for a higher than average return. A volatile investment can make you rich or devour your savings. A conservative investment will grow slowly and steadily over time. Let us assume that we have three invested categories: 1. conservative (high risk-averse) with ϴ of 5; 2. balanced (moderate risk-averse) with ϴ of 3.5; 3. adventurous (low risk-averse) with ϴ of 2. Notice that when ϴ goes to 0, investors focus more on a mean and pay less attention to all other moments.
Let us construct an optimal portfolio with the next stocks from the S&P500 index: Starbucks Corporation (SBUX), The Coca-Cola Company (KO), The Walt Disney Company (DIS), Caterpillar Inc. (CAT), and The Goldman Sachs Group, Inc. (GS). Below we can see the statistical description of the stocks and the equal-weighted portfolio. The parameters are calculated based on the log return of daily adjusted close prices for the period from May 16, 2012, to May 17, 2022. The Mean and the Standard Deviation are annualized for 252 trading days.

We can construct portfolios to maximize the Utility Function from Figure 1 by changing portfolio weights. I put two constraints for the portfolio maximization task: 1. We invest 100% of our capital into all our five stocks; 2. All of the weights are not negative, because we restrict short selling. So below, there are three portfolios based on the risk-averse coefficient (ϴ) of 5, 3.5, and 2, taking into account our optimization constraints.

According to Figure 3, Portfolio 3 (the lowest risk-averse portfolio with ϴ equal to 2) provides the highest expected return with the highest volatility level. Also, it is interesting to see that Portfolio 3 has the lowest skewness compared with the other two portfolios, and the Kurtosis for Portfolio 3 is less than for Portfolio 2. Moreover, depending on the risk-averse coefficient the weight of DIS goes to zero from the high-risk-averse portfolio to the low-risk-averse portfolio. We can also notice that shares of SBUX and GS increase significantly while the share of KO decreases from a high-risk-averse portfolio to a low-risk-averse portfolio.
Portfolio Construction: Conclusion
Portfolio construction which takes into account investors’ preferences regarding the risk level is one of the main things which promotes the increase in an investor’s well-being in the long term. Portfolio optimization which is based on the four moments utility function enables us to construct portfolios taking into account investors’ preferences about risk-aversion.
Disclosure: This article originally appeared on Iknowfirst.com, a financial services firm that utilizes an advanced ...
more

