
U.S. Stocks SuperMicro Computers Inc.
SuperMicro Computers Inc. (SMCI) – Daily Chart
SMCI Elliott Wave Technical Analysis
FUNCTION: Counter trend
MODE: Corrective
STRUCTURE: Flat
POSITION: Wave {v} of C
DIRECTION: Upward toward wave {v}
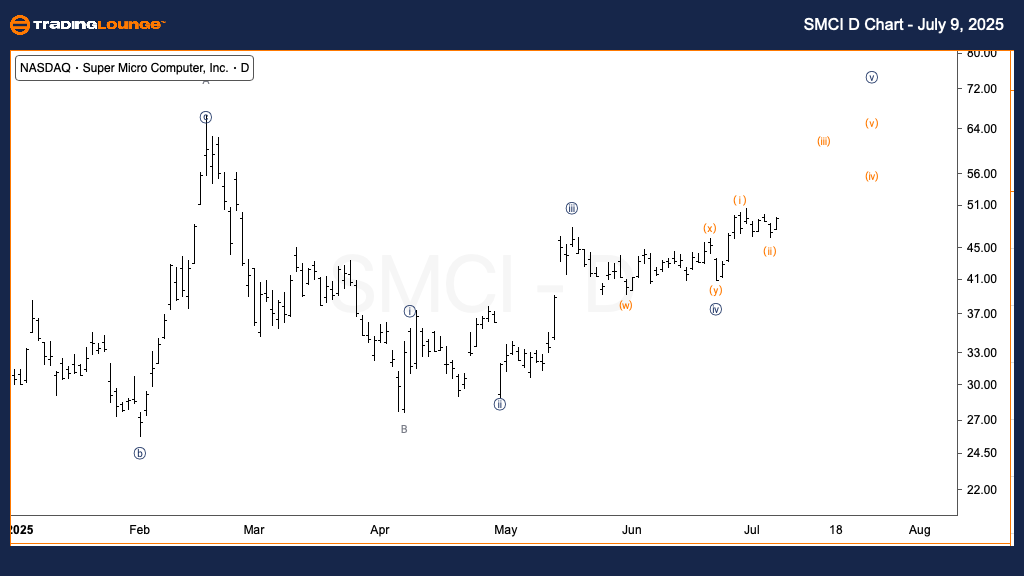
DETAILS: A major pullback has been ongoing since early this year. The current move suggests an upward push to finalize the correction.
On the daily chart, SuperMicro Computers Inc. (SMCI) is in the last stage of a corrective flat pattern that began at the start of 2025. The stock is currently advancing through wave {v} of C, indicating that the countertrend structure is nearly complete. This upward move is expected to form the final leg in the ongoing correction before the larger trend resumes.
SuperMicro Computers Inc. (SMCI) – 1H Chart
SMCI Elliott Wave Technical Analysis
FUNCTION: Counter trend
MODE: Corrective
STRUCTURE: Flat
POSITION: Wave (ii) of {v}
DIRECTION: Upside into wave (iii)
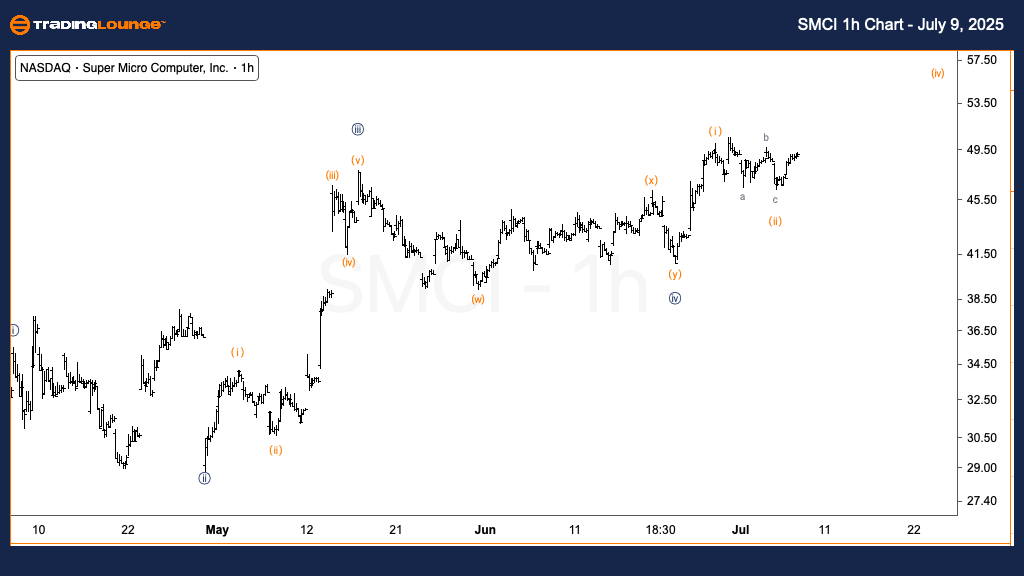
DETAILS: Wave (ii) seems to have completed. Price is nearing the $50 mark, a key level to confirm further upside potential.
In the 1-hour view, SMCI appears to have bottomed in wave (ii) of {v} and is now progressing into wave (iii). The price is closing in on the $50 level, a key area where prior support may be retested. If the price sustains above this zone, it would strengthen the bullish outlook and confirm the continuation of wave (iii), leading to the completion of wave C.
Technical Analyst: Alessio Barretta
More By This Author:
Unlocking ASX Trading Success: Mineral Resources Limited - Wednesday, July 9
Elliott Wave Technical Analysis - Nifty 50 Index
Bitcoin Crypto Price News Today - Wednesday, July 9
At TradingLounge™, we provide actionable Elliott Wave analysis across over 200 markets. Access live chat rooms, advanced AI & algorithmic charting tools, and curated trade ...
more

