
U.S. Stocks - Caterpillar Inc.
Caterpillar Inc. (CAT) – Detailed Elliott Wave Analysis
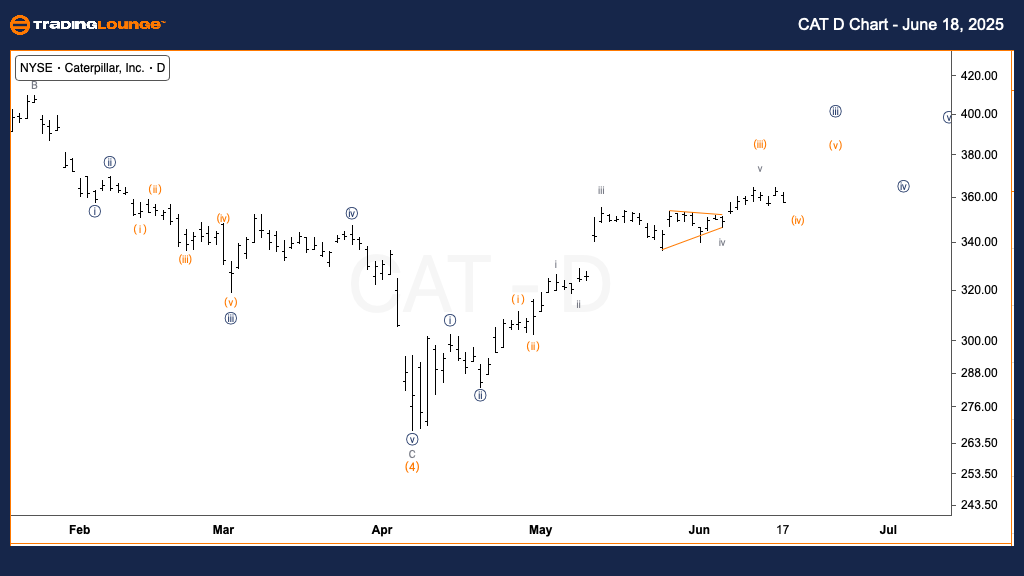
Daily Chart – Elliott Wave Technical Analysis
Function: Trend
Mode: Motive
Structure: Impulsive
Position: Wave (iv) of {iii}
Direction: Upside into wave (v)
Details: The corrective wave (iv) seems close to completing. The overall structure of minute wave {iii} suggests another leg up as part of wave (v). The broader trend remains upward.
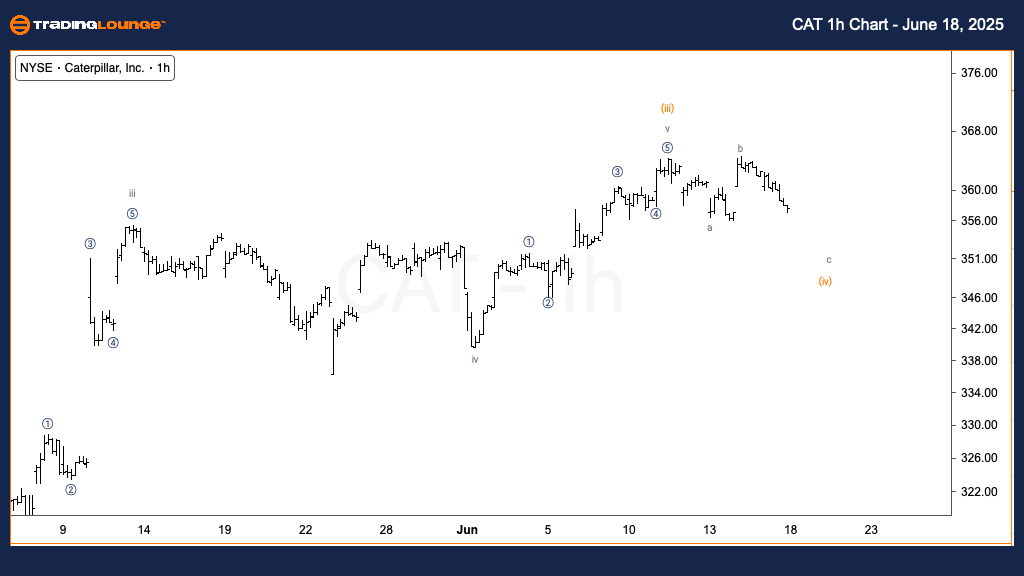
1-Hour Chart – Elliott Wave Technical Analysis
Function: Trend
Mode: Motive
Structure: Impulsive
Position: Wave c of (iv)
Direction: Possible bottom in wave c
Details: A final leg lower in wave c is expected. Potential support is near $350. A bounce from this level would confirm the end of wave (iv), setting the path toward $380, the target at MinorGroup2.
Technical Analyst: Alessio Barretta
More By This Author:
Unlocking ASX Trading Success: Cochlear Limited - Wednesday, June 18
Elliott Wave Technical Analysis: Wheat - Wednesday, June 18
Elliott Wave Technical Analysis: Australian Dollar/Japanese Yen - Wednesday, June 18
At TradingLounge™, we provide actionable Elliott Wave analysis across over 200 markets. Access live chat rooms, advanced AI & algorithmic charting tools, and curated trade ...
more

