
U.S. Stocks: Avery Dennison Corp.
Avery Dennison Corp. (AVY) – Elliott Wave Analysis | TradingLounge
Daily Chart Analysis – Technical Overview
Function: Trend
Mode: Motive
Structure: Impulsive
Position: Wave 3 of (1)
Direction: Upside into wave 3
Details: Price appears to have broken the previous downward structure from wave (C), supporting the start of wave 3.
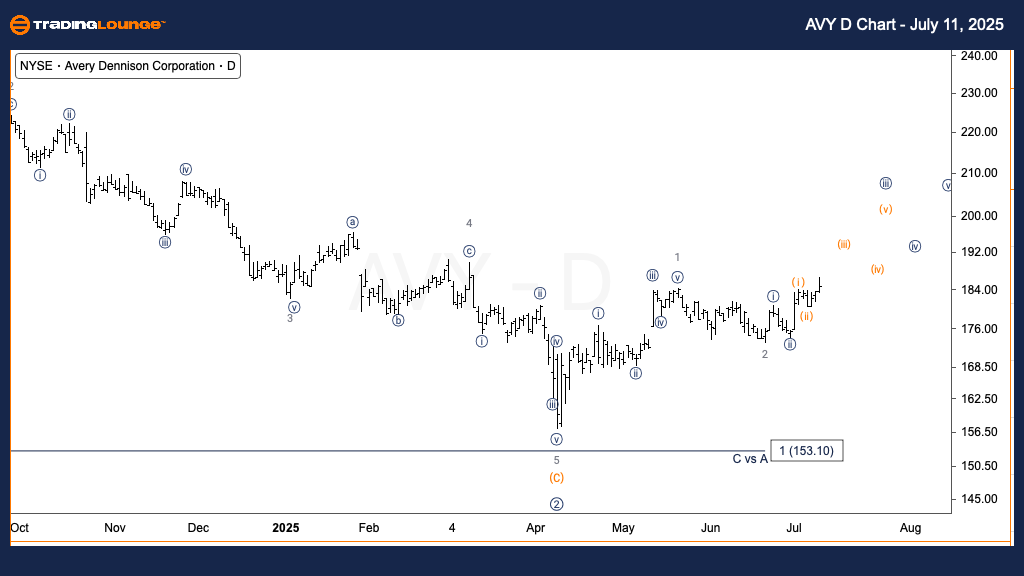
The daily chart of Avery Dennison Corp. (AVY) suggests the potential start of a new bullish impulsive phase. The stock has likely completed the corrective wave (C) and broken its previous downtrend, setting up for a continuation into wave 3 of (1). Wave 3 is generally the most powerful wave in an impulsive sequence, pointing to possible sustained upside momentum. This scenario aligns with a positive medium-term outlook for AVY.
1-Hour Chart Analysis – Technical Overview
Function: Trend
Mode: Motive
Structure: Impulsive
Position: Wave (iii) of {iii}
Direction: Upside in wave (iii)
Details: The current move is likely wave (iii) of {iii}, but it may also be topping in wave (v) of {i}, which would suggest a larger correction in wave {ii}.
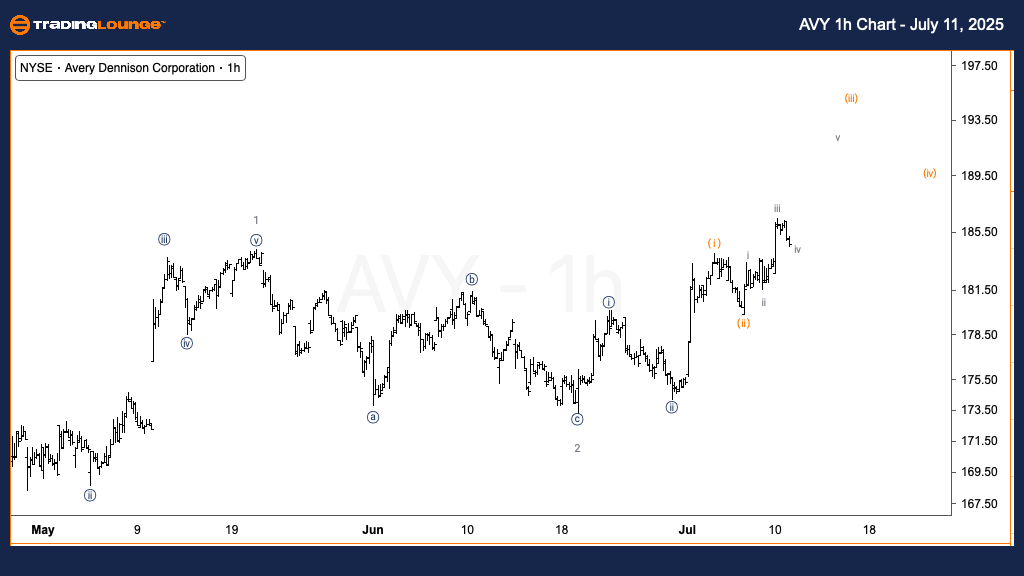
The 1-hour chart of AVY shows continued upward movement, indicating progression through wave (iii) of {iii}. This would confirm the strength of the current impulsive phase. However, an alternative count suggests the price might be finalizing wave (v) of {i}, meaning a deeper corrective wave {ii} could follow. Traders should monitor for further upside confirmation or signs of reversal to assess the next phase accurately.
Technical Analyst: Alessio Barretta
More By This Author:
Elliott Wave Technical Forecast: Newmont Corporation - Friday, July 11
U.S. Stocks - Riot Platforms, Inc.
Elliott Wave Technical Analysis: Australian Dollar/U.S. Dollar - Friday, July 11
At TradingLounge™, we provide actionable Elliott Wave analysis across over 200 markets. Access live chat rooms, advanced AI & algorithmic charting tools, and curated trade ...
more

