
AUDUSD Elliott Wave Analysis – Trading Lounge Day Chart
AUDUSD Elliott Wave Technical Analysis
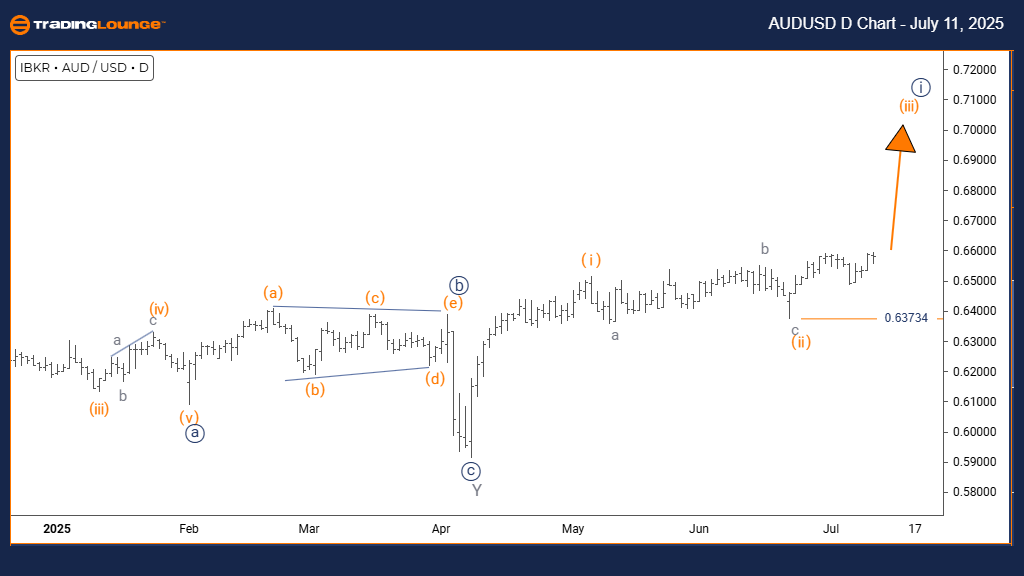
FUNCTION: Bullish Trend
MODE: Impulsive
STRUCTURE: Orange wave 3
POSITION: Navy blue wave 1
DIRECTION NEXT LOWER DEGREES: Orange wave 4
DETAILS: Orange wave 2 seems complete; orange wave 3 is now active.
Invalidation Level: 0.63734
The daily Elliott Wave analysis of AUDUSD shows a bullish trend with strong impulsive behavior. Orange wave 3 is currently unfolding within the broader navy blue wave 1, indicating the beginning of a potential major uptrend. The next expected step in this wave sequence is orange wave 4, a corrective move likely to follow wave 3’s completion. Observations suggest orange wave 2 has ended, and orange wave 3, typically the longest and strongest wave, is now underway.
The current bullish trend is backed by consistent upward momentum, driven by buyer interest. A break below 0.63734 would invalidate the wave count and change the bullish outlook. The daily timeframe gives this analysis broader context and reliability. With wave 3 usually providing the clearest upward strength in Elliott Wave theory, this setup suggests significant upside potential. Traders should watch for confirmation signs of continued wave progress while maintaining awareness of the key invalidation level.
AUDUSD Elliott Wave Analysis – Trading Lounge 4-Hour Chart
AUDUSD Elliott Wave Technical Analysis
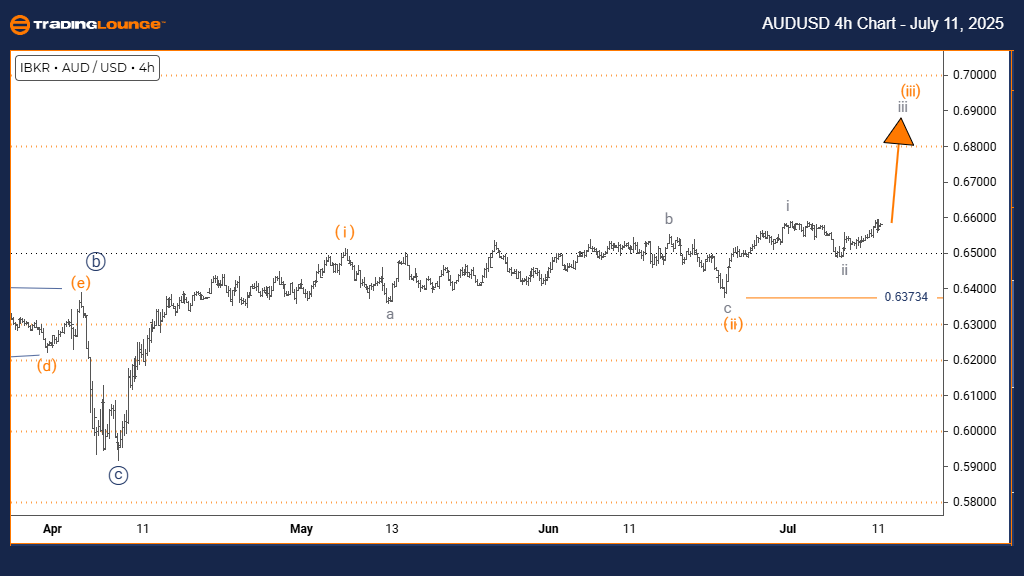
FUNCTION: Bullish Trend
MODE: Impulsive
STRUCTURE: Gray wave 3
POSITION: Orange wave 3
DIRECTION NEXT HIGHER DEGREES: Gray wave 3 (begun)
DETAILS: Gray wave 2 seems completed; gray wave 3 is in play.
Invalidation Level: 0.63734
The 4-hour chart analysis of AUDUSD indicates a strong bullish trend via Elliott Wave interpretation. The pair is moving through gray wave 3 inside orange wave 3, marking a potent upward phase. Following gray wave 2’s apparent completion, the chart suggests the start of a typically aggressive and extended wave 3 movement. This phase is often the most trade-worthy due to clear momentum and trend direction.
As long as prices remain above 0.63734, the bullish structure holds. The impulsive wave characteristics align with rising buyer pressure and support sustained gains. This 4-hour timeframe offers a detailed yet broader view, helping traders track real-time developments while filtering minor fluctuations. The analysis supports continued upside if wave patterns remain intact and can help guide trade entries and exits.
Technical Analyst: Malik Awais
More By This Author:
Elliott Wave Technical Forecast: Newmont Corporation - Friday, July 11
Indian Stocks: Infosys Laboratories
Elliott Wave Technical Forecast: Amcor Plc


Comments
Log in or sign up to join the conversation.