
Riot Platforms, Inc. (RIOT) – Elliott Wave Analysis | TradingLounge
Daily Chart Analysis – Technical Overview
Function: Trend
Mode: Motive
Structure: Impulsive
Position: Wave {v} of 3
Direction: Bullish
Details: Wave {v} of 3 likely targets the 161.8% Fibonacci level of Wave 1.
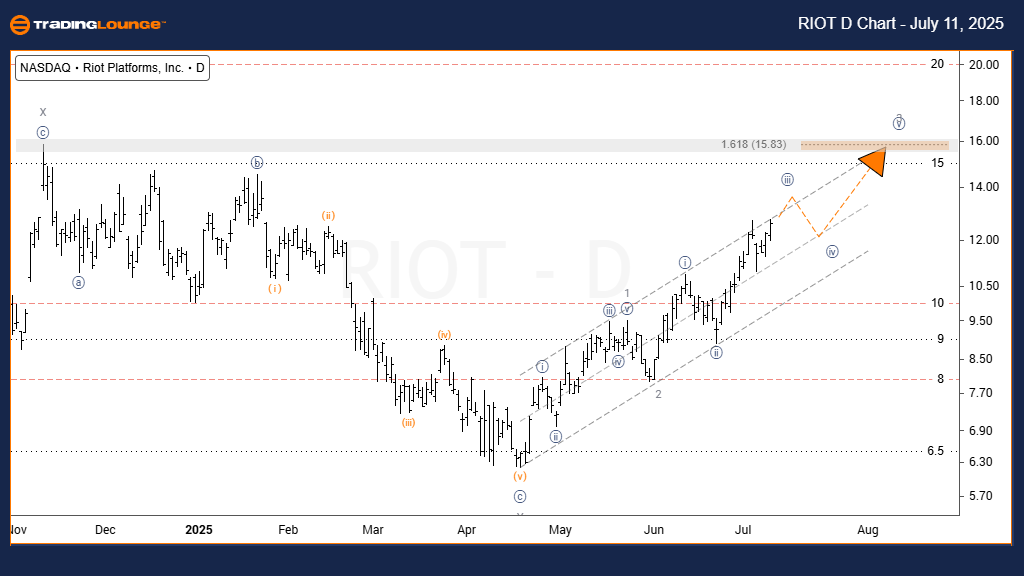
On the daily chart, Riot Platforms, Inc. (RIOT) maintains a strong upward trajectory, advancing within Wave {v} of 3. A breakout above the resistance trendline is expected, potentially signaling the continuation of an impulsive move. As Wave {v} of 3 is often the extended leg in Elliott Wave theory, a projected target near the 161.8% Fibonacci extension of Wave 1 is a reasonable expectation. This setup offers an attractive short-term bullish trading opportunity, aligned with momentum.
Weekly Chart Analysis – Technical Overview
Function: Trend
Mode: Motive
Structure: Impulsive
Position: Wave C of (B)
Direction: Bullish
Details: Following a channel breakout, prices may rally sharply to complete Wave C of (B).
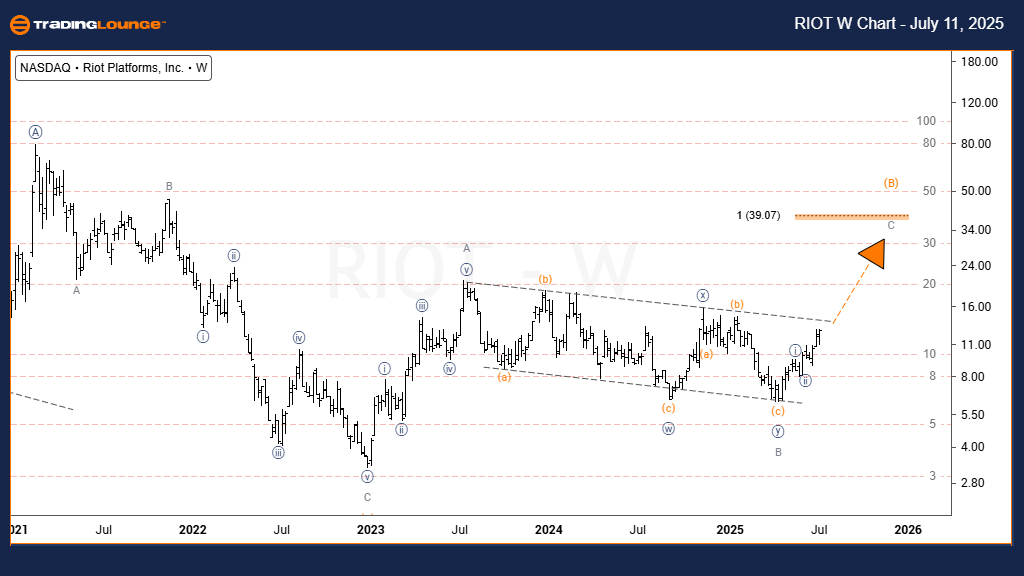
On the weekly timeframe, RIOT is progressing through an impulsive wave within a larger corrective structure. The current move is identified as Wave C of (B), with a potential target around the 100% Fibonacci projection of Wave (A). This wave often produces a strong upward push, especially after a breakout from a parallel channel. While the bullish structure remains intact, traders should monitor key resistance zones and potential consolidation before the trend resumes.
Technical Analyst: Dhiren Pahuja
More By This Author:
Elliott Wave Technical Forecast: Newmont Corporation - Friday, July 11
Elliott Wave Technical Analysis: Australian Dollar/U.S. Dollar - Friday, July 11
Indian Stocks: Infosys Laboratories


Comments
Log in or sign up to join the conversation.