
AAPL Elliott Wave Analysis – Trading Lounge Daily Chart
Apple Inc. (AAPL) – Daily Chart
AAPL Elliott Wave Technical Analysis
Function: Countertrend
Mode: Corrective
Structure: Flat
Position: Wave {c} of B
Direction: Upside in {c}
Details: Expecting further upside in wave {c}, with key Fibonacci targets at $224 (0.618 projection) and $244 (equality to wave {a}).
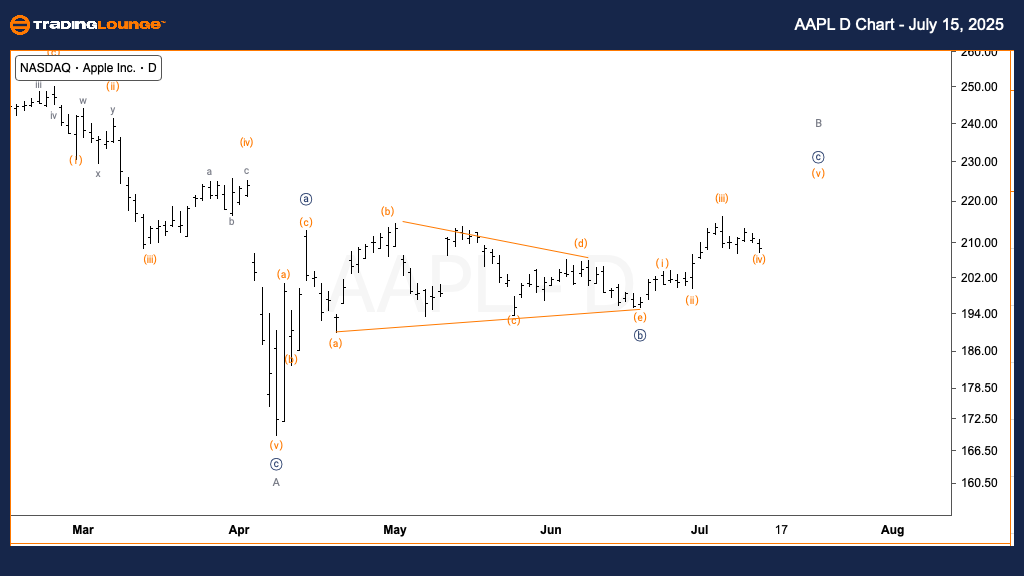
The daily chart of Apple Inc. (AAPL) shows a corrective countertrend move currently unfolding as wave {c} of B. This structure is part of a broader flat correction. Based on Fibonacci measurements, potential resistance targets include $224 and $244, representing 0.618 and 1.000 extensions of wave {a}, respectively. The outlook indicates more upside before the correction finalizes and the main trend direction resumes.
AAPL Elliott Wave Analysis – Trading Lounge 1-Hour Chart
Apple Inc. (AAPL) – 1-Hour Chart
AAPL Elliott Wave Technical Analysis
Function: Countertrend
Mode: Corrective
Structure: Flat
Position: Wave (iv) of {c}
Direction: Upside in {c}
Details: Wave (iv) may have already bottomed after a clear three-wave decline. Now anticipating wave (v) of {c} to rise. As wave (iii) was not shorter than wave (i), wave (v) could extend.
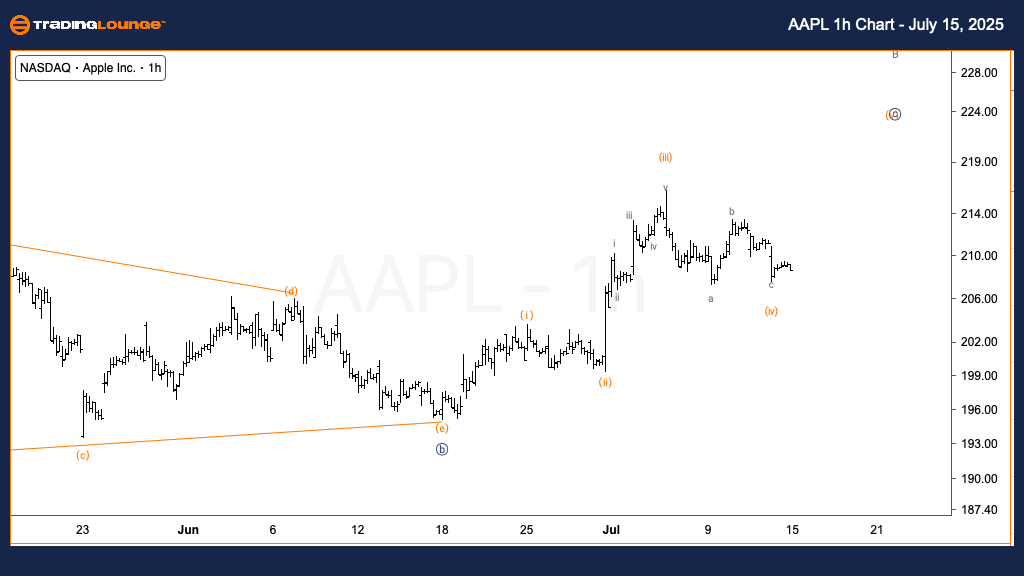
The 1-hour chart indicates that wave (iv) of {c} may have completed, setting the stage for a final push higher in wave (v). Given that wave (iii) exceeded wave (i) in length, an extension in wave (v) is possible. This favors a bullish short-term view, with traders watching for a strong move into the $224–$244 target zone to complete wave {c}.
Technical Analyst: Alessio Barretta
More By This Author:
Unlocking ASX Trading Success: Unibail-Rodamco-Westfield - Tuesday, July 15
Elliott Wave Technical Analysis: British Pound/Australian Dollar - Tuesday, July 15
Indian Stocks - Coal India


Comments
Log in or sign up to join the conversation.