
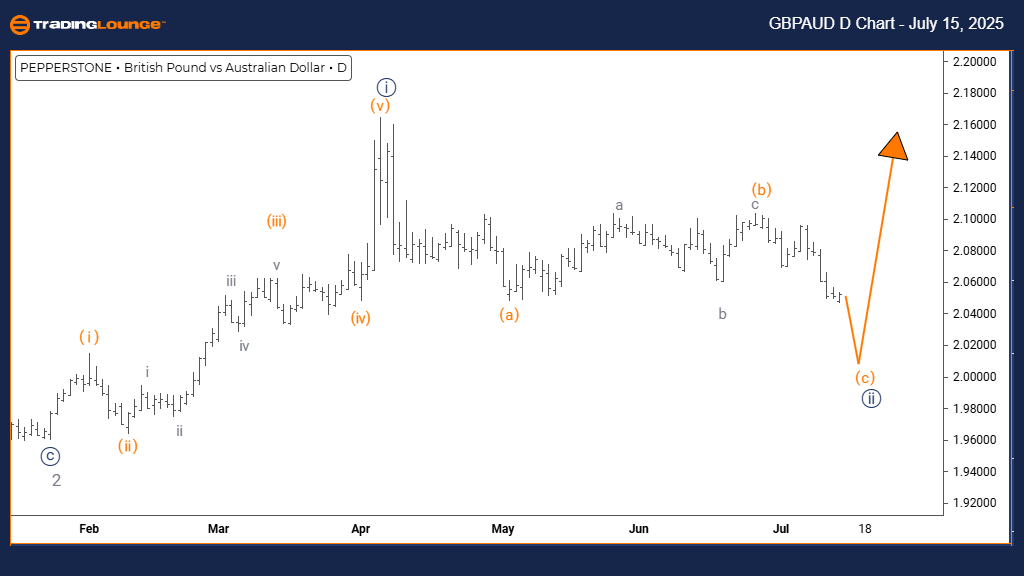
British Pound / Australian Dollar (GBPAUD) – Daily Chart
GBPAUD Elliott Wave Technical Analysis
Function: Counter Trend
Mode: Corrective
Structure: Navy Blue Wave 2
Position: Gray Wave 3
Direction Next Higher Degrees: Navy Blue Wave 3
Details: Navy Blue Wave 1 is complete; Navy Blue Wave 2 is now developing.
The GBPAUD daily Elliott Wave chart analysis highlights a counter-trend scenario with corrective price activity. Navy Blue Wave 2 is forming within the broader Gray Wave 3 structure. This suggests the currency pair is retracing temporarily before resuming the main trend.
With Navy Blue Wave 1 complete, price action has shifted into Navy Blue Wave 2. This wave typically marks a pause or pullback before an upward move resumes. The corrective structure implies weaker directional strength compared to impulsive waves, often leading to shallow or sideways movement.
This analysis framework helps traders watch for the end of the current correction. Once Navy Blue Wave 2 is finished, it may give way to Navy Blue Wave 3, expected to follow with strong momentum. Since the pair remains inside Gray Wave 3, the broader uptrend is still in place.
Traders should focus on identifying signs of completion for Navy Blue Wave 2. This could signal the start of the next impulsive phase. Overall, the daily chart analysis provides valuable insight into where the pair is in the broader market cycle.
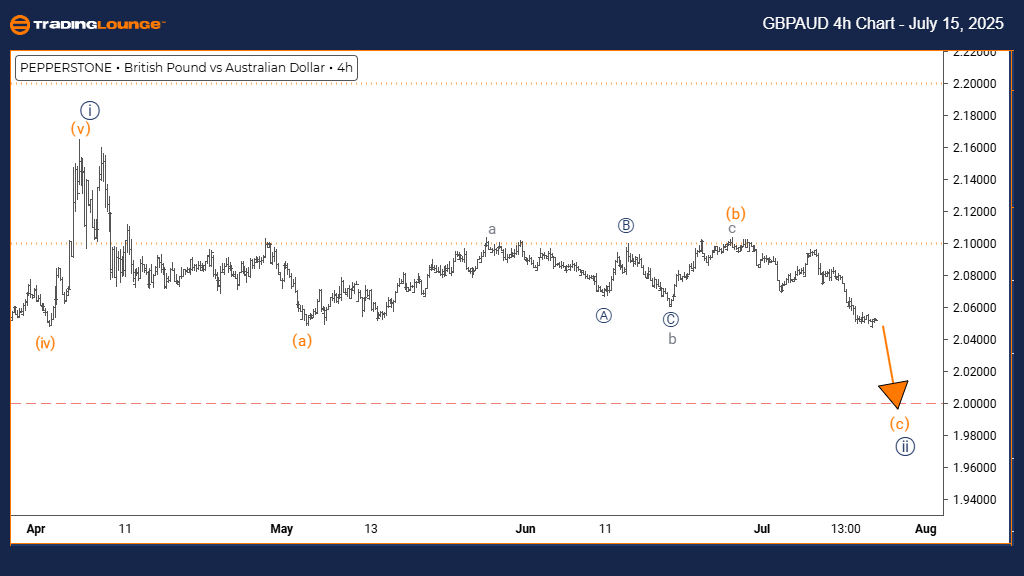
British Pound / Australian Dollar (GBPAUD) – 4-Hour Chart
GBPAUD Elliott Wave Technical Analysis
Function: Counter Trend
Mode: Impulsive
Structure: Orange Wave C
Position: Navy Blue Wave 2
Direction Next Lower Degrees: Orange Wave C (Started)
Details: Orange Wave B appears complete; Orange Wave C is now active.
The 4-hour Elliott Wave analysis of GBPAUD shows a counter-trend phase with impulsive movement, signaling the development of Orange Wave C within the broader Navy Blue Wave 2 correction. This setup suggests a short-term pullback amid a larger uptrend.
Orange Wave B has ended, and Orange Wave C is now in play. As the final part of the corrective sequence, this wave typically moves with intensity and deep retracement. Since this wave is part of Navy Blue Wave 2, it reflects a temporary structure before the primary trend continues.
The current impulsive move in Orange Wave C implies strong downside momentum in the short term. Traders should monitor this move for signs of exhaustion, signaling the end of Navy Blue Wave 2 and a potential start of a longer upward move.
This analysis helps traders prepare for the next phase. Wave C structures often end sharply, so identifying turning points can create opportunities. Despite the temporary nature, the momentum in this wave can be substantial and should be managed with caution.
Technical Analyst: Malik Awais
More By This Author:
Indian Stocks - Coal India
Elliott Wave Technical Analysis: Bitcoin Crypto Price News For Tuesday, July 15
U.S. Stocks - Zoom Communications Inc.


Comments
Log in or sign up to join the conversation.