
COAL INDIA Elliott Wave Analysis – Trading Lounge Day Chart
COAL INDIA Elliott Wave Technical Analysis
Function: Counter Trend
Mode: Impulsive
Structure: Gray Wave C
Position: Orange Wave 2
Direction Next Lower Degrees: Gray Wave C (Started)
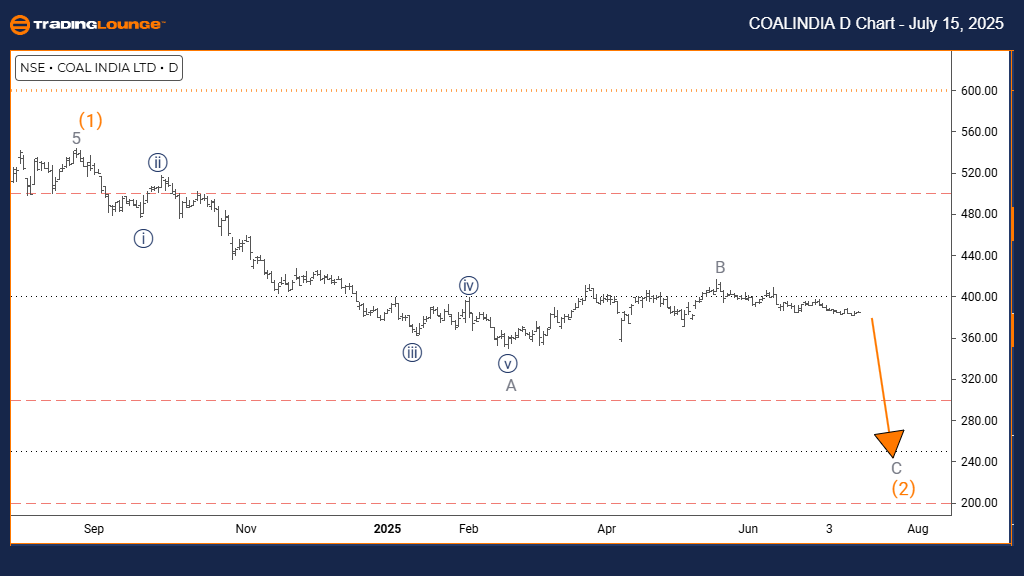
Details: Gray Wave B appears complete; Gray Wave C is now underway.
The daily chart analysis of COAL INDIA, using the Elliott Wave method, shows a counter-trend setup. Price action is now impulsive, indicating that Gray Wave C has started within the broader corrective pattern, located at Orange Wave 2.
Current analysis shows Gray Wave B has likely ended. With Gray Wave C now active, the chart reflects a typical final wave in a corrective sequence. This movement usually ends the corrective phase before the main trend continues.
The impulsive pattern of Gray Wave C indicates strong downward momentum. Since this wave has just begun, further declines are possible. This setup shows that COAL INDIA is in a corrective stage, with Gray Wave C expected to complete the overall correction.
Positioned in Orange Wave 2, this structure may be part of a larger correction. Gray Wave C is a key portion of this setup. Traders should watch for signs of Gray Wave C nearing completion, which could signal the end of the counter-trend and the return of the primary trend. The impulsive move in Gray Wave C suggests this decline may continue with strength before ending.
This analysis helps traders understand COAL INDIA’s current place in the broader market cycle. The ongoing downward movement could still have room to run. As counter-trend moves can be unpredictable, caution is advised. Elliott Wave theory offers a guide to identify key turning points, though such environments often require strong risk control strategies.
COAL INDIA Elliott Wave Analysis – Trading Lounge Weekly Chart
COAL INDIA Elliott Wave Technical Analysis
Function: Counter Trend
Mode: Impulsive
Structure: Gray Wave C
Position: Orange Wave 2
Direction Next Higher Degrees: Orange Wave 3
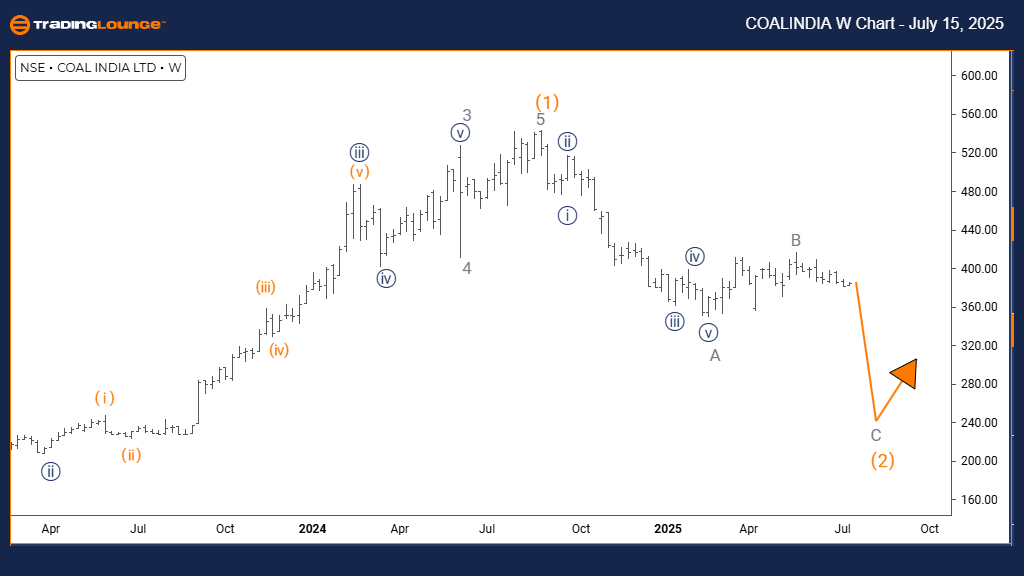
Details: Gray Wave B appears complete; Gray Wave C is now developing.
The weekly Elliott Wave analysis for COAL INDIA shows a counter-trend phase within a broader correction. Price action is forming Gray Wave C, which is part of the Orange Wave 2 pattern. This suggests the stock is undergoing a noticeable pullback within a larger trend.
Technical signals confirm the end of Gray Wave B. The chart now reflects the beginning of Gray Wave C, which is usually the last leg in a three-part correction. The impulsive behavior of this wave suggests strong downward price momentum.
The current pattern, part of Orange Wave 2, signals an intermediate correction. Following this, Orange Wave 3 at a higher degree is expected to restart the main trend. This setup suggests that COAL INDIA is nearing the end of its correction, with Gray Wave C likely completing the final stage.
Traders should closely monitor Gray Wave C for any signs of weakening. Once this wave finishes, it would indicate the end of Orange Wave 2 and the possible start of Orange Wave 3. The impulsive pattern of Gray Wave C may continue pushing prices down before stabilizing.
This weekly analysis helps place the stock within its broader trend. It implies that the counter-trend move could soon finish. Elliott Wave theory helps identify key reversal points. However, these setups can be difficult to trade, so traders should manage risk carefully.
Technical Analyst: Malik Awais
More By This Author:
Elliott Wave Technical Analysis: Bitcoin Crypto Price News For Tuesday, July 15
U.S. Stocks - Zoom Communications Inc.
Elliott Wave Technical Analysis: Euro/U.S. Dollar - Monday, July 14


Comments
Log in or sign up to join the conversation.