
Under The Surface, Many Stocks Are Down A Lot
Year to date through March 11, 2022, the price-only return for the S&P 500 Index shows it down 11.29%, however, the index remains up 6.73% on a one-year basis. Since the end of the financial crisis in 2009, and including the 2009 calendar year, the S&P 500 Index experienced just one down calendar year and that was in 2018 when the index was down a -6.2% or -4.4% on a total return basis. With inflation seemingly less likely to be transitory, oil prices at record highs, and the geopolitical events of Russia's invasion into Ukraine and Iran shooting missiles at U.S. and Israel targets in Iraq, it seems negative news flow cannot get much worse.
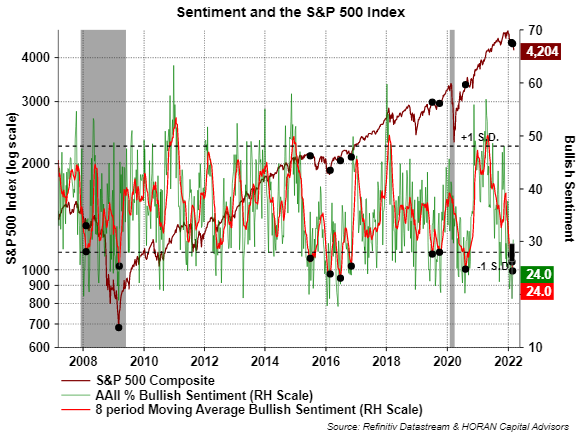
The 11.29% YTD S&P 500 Index decline is less than the average intra-year decline of 14% going back to 1950 though. For good reasons, this recent pullback feels much worse though given the significant pullback in a large number of stocks that comprise the indexes. This under-the-surface weakness has influenced individual investor sentiment measures like the weekly AAII Sentiment Survey. The latest Sentiment Survey shows bullish sentiment at a low 24% and the 8-period average is an equally low 24% too. Keeping in mind the investor sentiment measures are contrarian ones, the below chart shows these readings are near extreme lows.
(Click on image to enlarge)
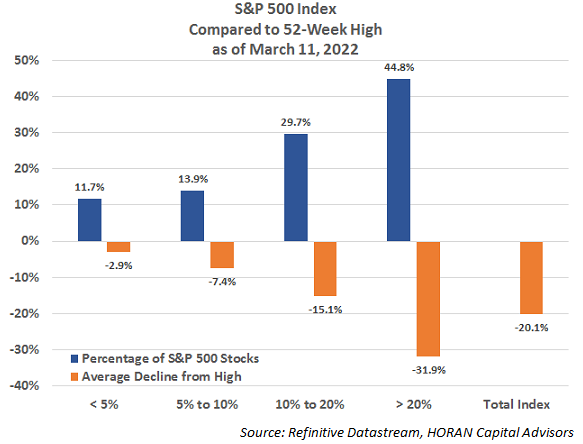
I highlighted the weakness under the surface of the indexes in a post I wrote at the end of July last year while the equity market was trading near a high. Today, both the number and magnitude of the stocks showing weakness within the indexes are much worse than last summer. For the S&P 500 Index, almost half of the stocks in the index are down greater than 20% from their most recent 52-week high, in fact, 44.8% are down an average of 31.9%. Another 29.7% are down 15.1% from their one-year high. In total, nearly 75% of S&P 500 Index stocks are down 75% from their 52-week highs. The average stock in the index is down 20.1%.
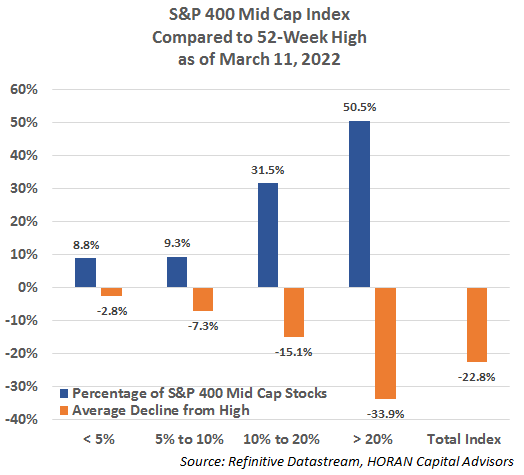
The lower market cap indexes have experienced even more weakness. The S&P 400 Mid Cap Index is showing 82% of the index holdings are down greater than 10% from their 52-week highs. Just over 50% are down an average of 33.9% and the average stock in the Mid Cap Index is down 22.8%.
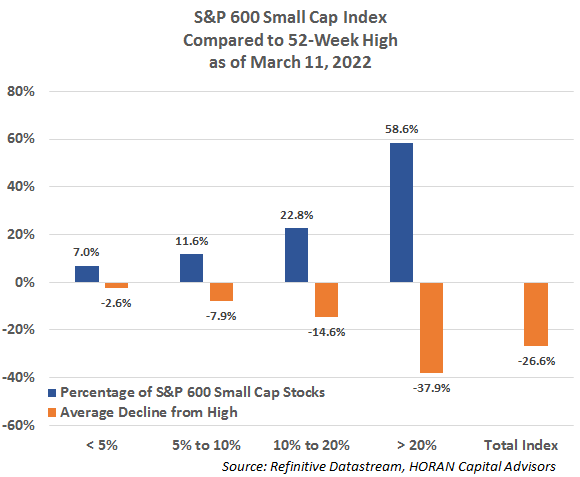
The S&P 600 Small Cap Index is exhibiting the greatest weakness among its holdings with 81.4% being down more than 10%. The small cap index has the largest number of stocks down more than 20% at 58.6%. The average stock in the small cap index is down 26.6% from its 52-week highs.
Although the stocks within the indexes have seen broad weakness, there are some sentiment measures that do not confirm an oversold bottom is in place yet and maybe for justifiable reasons. Without going into all of the other measures, like the VIX and CBOE Equity Put/Call ratio, to name a few, another example is the percentage of stocks trading above their 50-day simple moving average. With just over 25% of S&P 500 stocks trading above their 50-day moving average, this is suggestive that a washout bottom is not in place. As the below chart shows, significant bottoms tend to occur when the percentage of stocks above their 50-day moving average reaches into the mid-teens or lower. The green lines on the chart are areas where the percentage is at 25% or less.
(Click on image to enlarge)
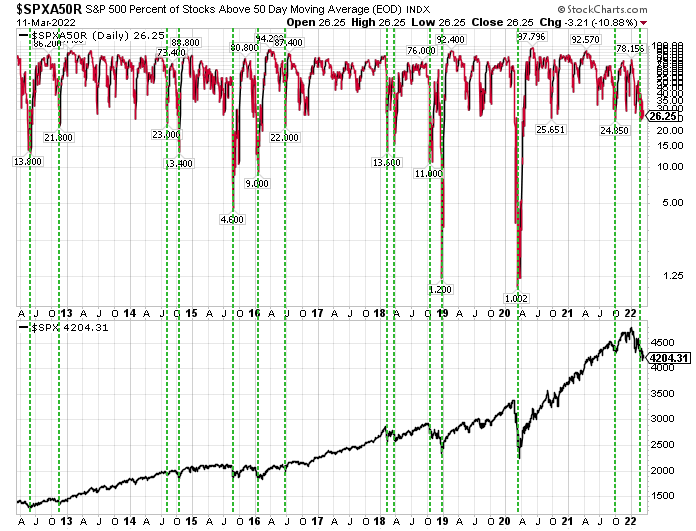
Of note though, there are 128 stocks trading above their 50-day moving average. Of those stocks, 19 are in the energy sector, 19 are utility sector stocks and 18 are industrial sector stocks. For reasons that are good for energy, tight supply that is being limited by the Russia/Ukraine conflict, and a U.S. energy policy from Washington that is not favorable to the oil industry, it can be supported that these stocks trade at higher prices, i.e., above their 50-day moving average. Some of the industrial stocks trading above their 50-day moving fall into the defense sector and have a near-term favorable outlook given the geopolitical events. Others in the industrial sector have businesses driven by commodities and agriculture, i.e. Caterpillar (CAT) and Deere (DE). Utilities face a headwind with fed rate hikes on the horizon, but their higher yields and business largely focused in the U.S., make these company stocks somewhat of a safe haven type investment, or at least a bond-like substitute.
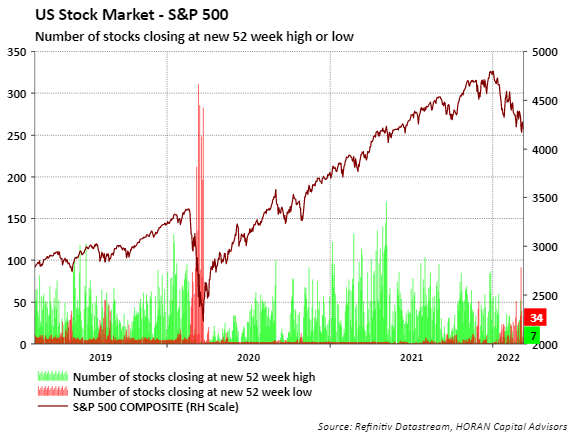
Lastly, capitulation bottoms have characteristics where trading volume spikes and the number of stocks making new lows spikes. As the below chart shows, 52-week new lows appear elevated but not at extremes, The number of new 52-week highs has declined and would be indicative of the weakness seen this year. The mixed trading and sentiment data are a few factors clouding the anticipated future direction of the market. However, with a large number of stocks down a lot, there are opportunities in individual stocks that are beginning to surface.
Disclaimer: The information and content should not be construed as a recommendation to invest or trade in any type of security. Neither the information nor any opinion expressed constitutes a ...
more

