
Traders Made Lemonade Out Of Thursday's Lemons. Still...

It could have been worse. And at one point, it was. The S&P 500 was down as much as 3% on Thursday before clawing its way back to a more muted loss of 1.45%. Nevertheless, the move left the index below critical technical ceilings and left the bigger downtrend intact.
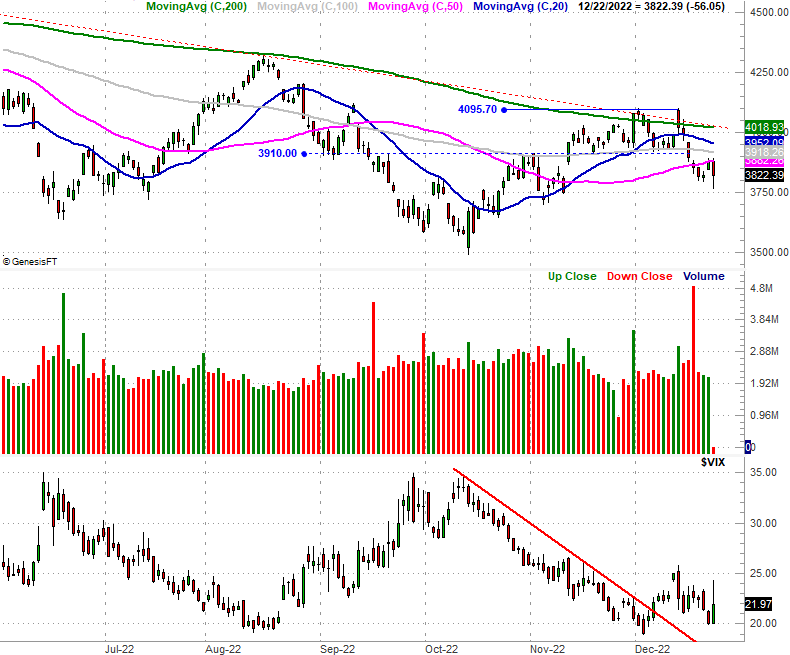
Take a look. The S&P 500 opened just below its 50-day moving average line (purple) on Thursday, sold off -- hard -- before bouncing back (somewhat) later in the session. Even so, the index was unable to work its way back above the 50-day line that started slowing things down on Wednesday.
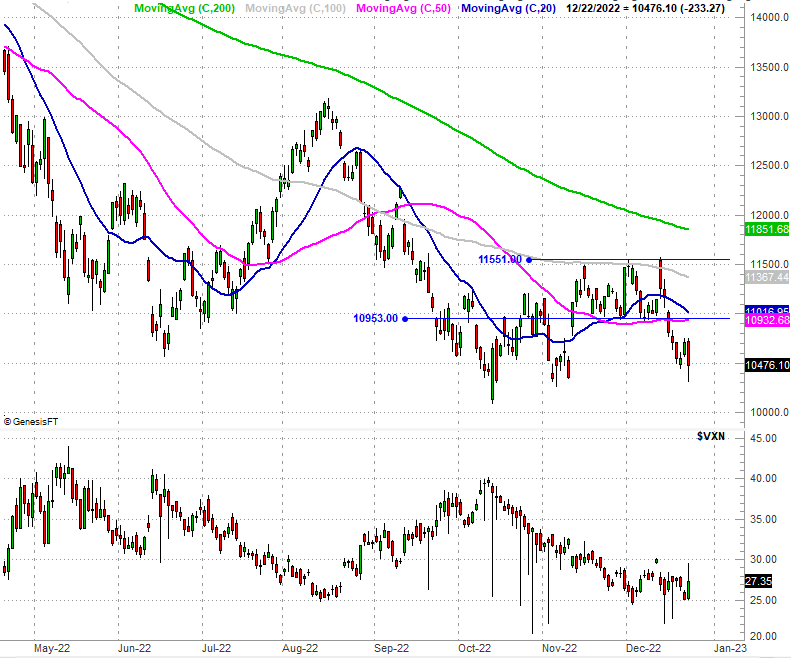
The Nasdaq Composite made the same basic move, though never threatening to push its way back above what's turning into a major make-or-break level around 10,950.
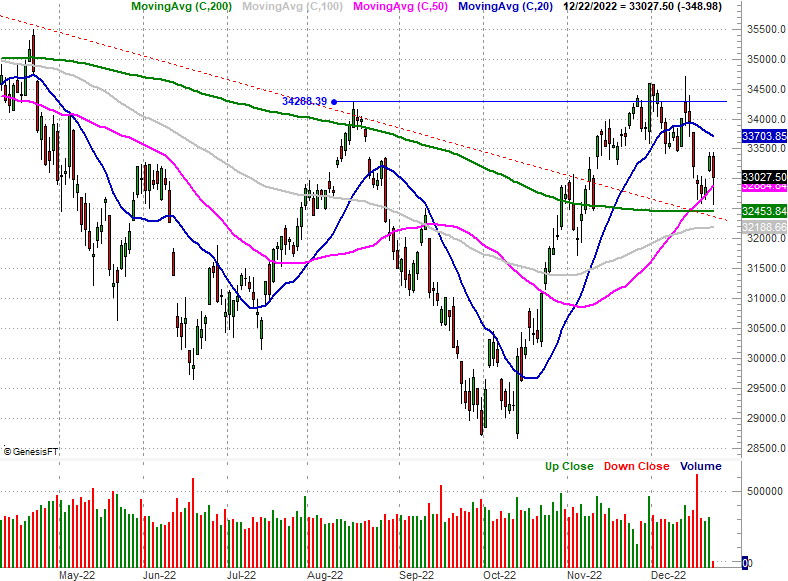
There is one bastion of hope. The Dow Jones Industrial Average found support at its 50-day moving average line (purple) late last week and early this week, pushing up and off of it to log a sizeable win on Wednesday. The sellers tried to undo that strength today, driving the index briefly under its 50-day average on Thursday. By the time the closing bell rang, though, the Dow was back above this moving average line. The bulls seem to have drawn a line in the sand... although this bullish interest in blue chips may indicate a "flight to safety" rooted in the assumption that lower overall lows are in the cards.
This still isn't exactly unusual, nor does it preclude the possibility of a Santa Claus rally. Indeed, stocks are still typically lethargic-to-bearish leading into Christmas when the whole year is a loser, with the rally actually taking shape in the week between Christmas and New Year's.
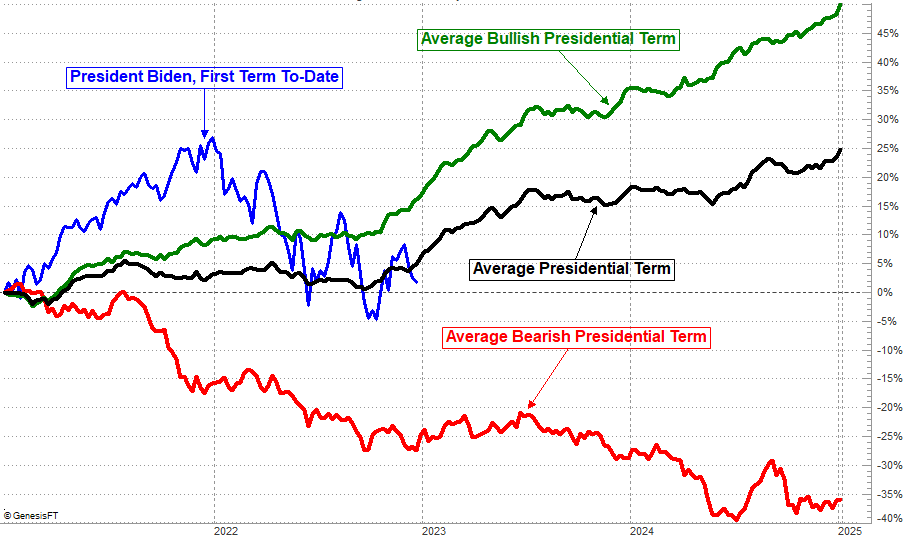
That's why we still don't want to read too much into the current weakness. It could end abruptly, and soon. Indeed, despite being in the midst of a bear market, the first half of the coming year should be... well, at least ok, if the market's action in the third year of a Presidential term is any indication. This is usually when we see gridlock between mixed party leadership, which is miserable to see as a citizen, but often encouraging to investors. The "status quo" means little gets done in the way of legislation, which in turn means Congress leaves companies alone to let them do what they want to do.
The bad news? The latter half of the third year of a Presidential term usually dishes out weakness.
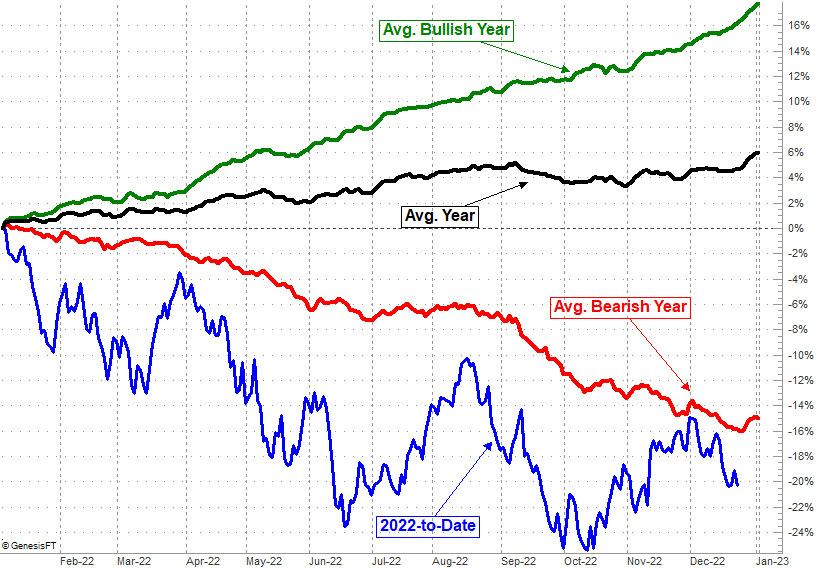
There's a bit of a problem with the timing of all of this. That's the fact that we're in a bear market, and have been since January. The average bear market lasts 15 months, which would put the bottom of this one sometime in April. The average bear market also shaves about 38% off the S&P 500's peak value. That's not happened yet. The S&P 500 would need to fall to around the 3000 to hit that milestone. That's more than 800 points below where we are right now, so we need to see one more major round of selling sooner or later. In some ways what we're seeing now could be the beginning of this. In other ways it might not be. Ugh.
As has been the case for a while, keep daily tabs on the indices for clues as to what lies immediately ahead.
More By This Author:
Stocks Are Hangin' On For Dear Life
Weekly Market Outlook - It Coulda Been Worse, But Not By Much
Weekly Market Outlook - The Bulls Are Still In The Fight, But Just Barely


