
Stocks Are Hangin' On For Dear Life
When they absolutely had to, the bulls made their stand.

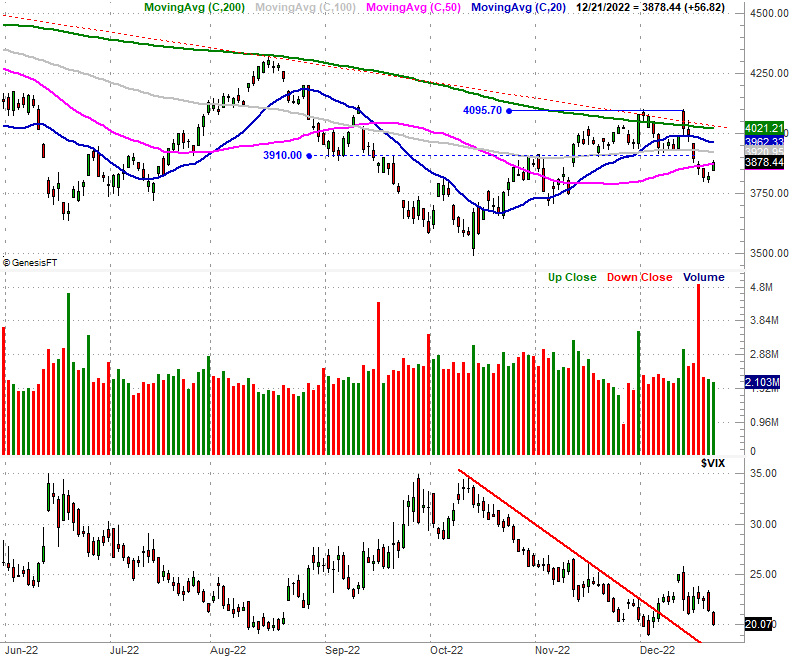
After getting shellacked late last week and early this week -- breaking key support levels in the process -- the indices managed a bullish session on Wednesday. It was so bullish, in fact, that the S&P 500 bounced back above its last-ditch floor... barely. Wednesday's close of 3878.44 was just a hair above the 50-day moving average line (purple) that failed to keep the index popper up as of the end of last week.
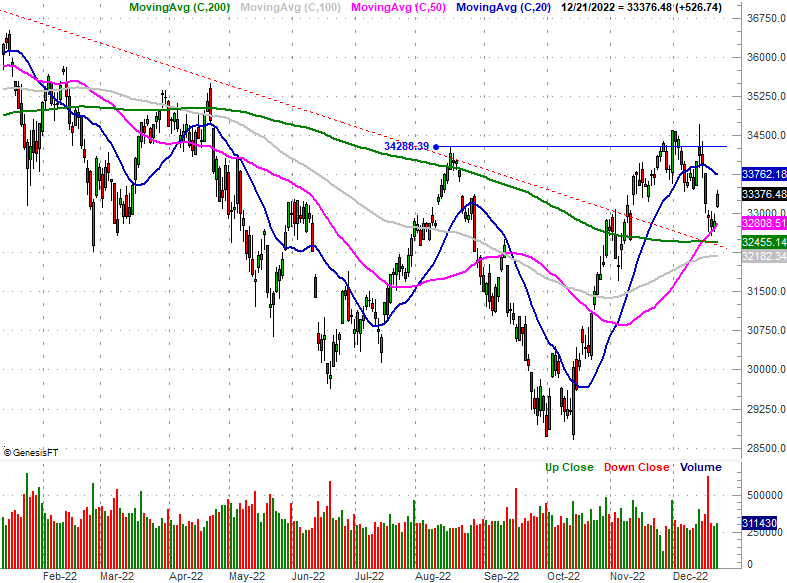
The Dow Jones Industrial Average is faring even better. Rather than breaking below its 50-day moving average line (purple) last week or this week, it seems to be pushing up and off of it to make Wednesday's surge.
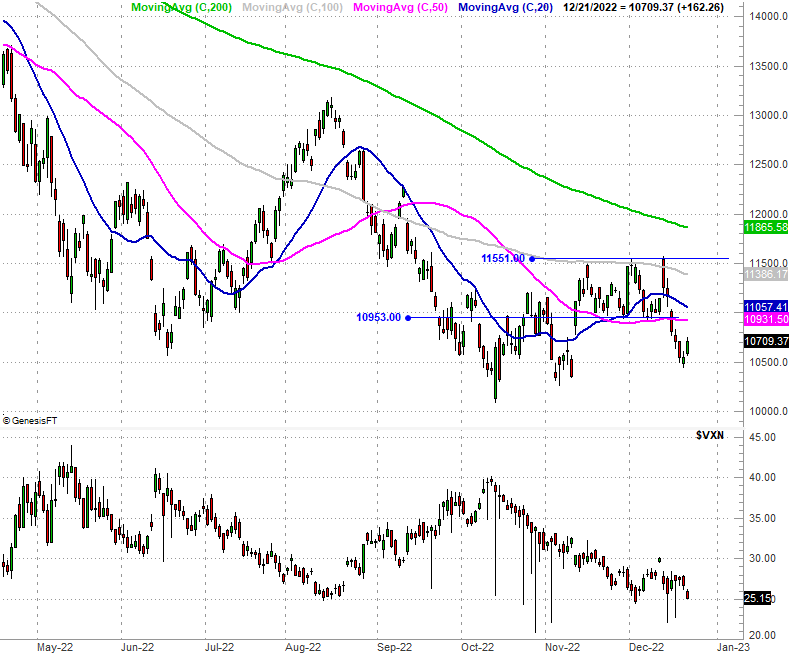
The only index nit exactly playing along is the Nasdaq Composite. It pulled under all of its key moving averages late last week, and even with Wednesday's 1.55% gain it's still not back above that indicator line.
Despite the Nasdaq's lagging, the bulls have the edge here... particularly given how Thursday's pre-session futures are up. Don't get too excited just yet though. The Nasdaq is the index we really want (and even need) to see making the best technical progress. It isn't. Also know that the breadth and depth behind Wednesday's advance isn't exactly compelling. The NYSE's bullish volume was just so-so, as was the sheer number of advancers listed at the NYSE.
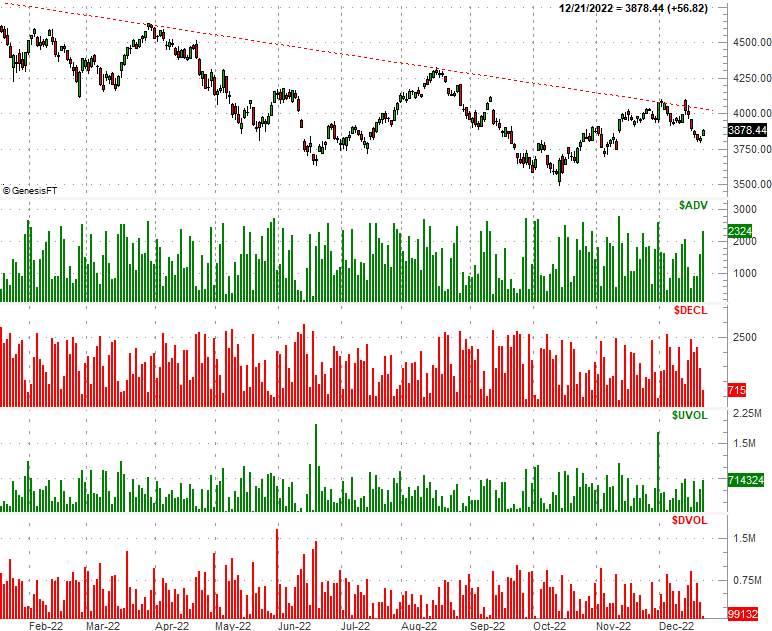
Ditto for Nasdaq-listed stocks. That is, the number of Nasdaq names moving higher on Wednesday was just a bit above average, while the volume behind the move was downright anemic given the scope of the gain.
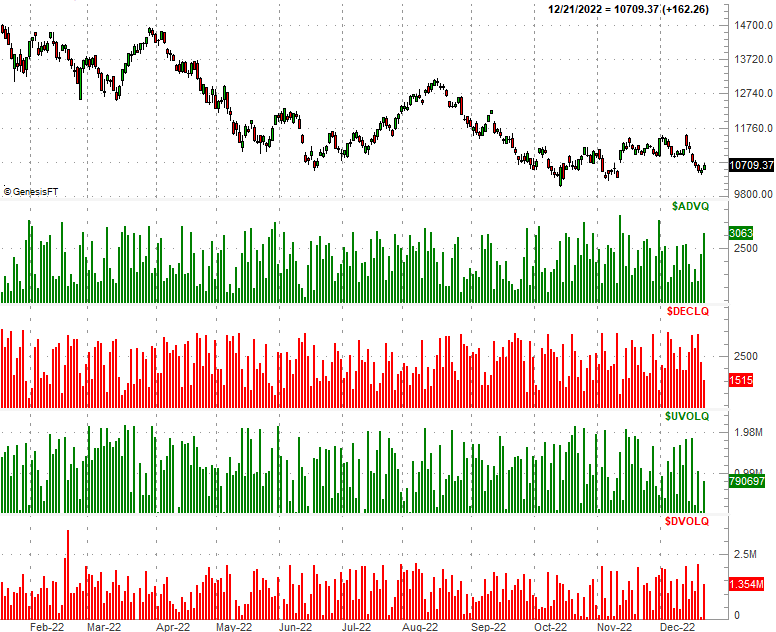
In other words, real interest in being bullish here is tepid.
And that's not exactly surprising. This is roughly the time investors start anticipating a Santa Claus rally, making a point of stepping into stocks (and therefore bidding them up) before it materializes. Once the timeframe for the usual year-end Santa Claus rally passes, this tepid bullish interest could easily do the same.
The good news is, the usual technical "tells" still apply regardless of how well or how poorly we end the calendar year. That matters simply because the indices all still have key technical lines in play... mostly above. For the S&P 500 that's a narrow band of resistance made up of all of its other moving averages lines, from 3925 to 4020. For the composite, the upper boundary stands around 11,550 (and the Nasdaq's 200-day moving average line could be right around there by the time it could be tested). The Dow's ultimate ceiling is the trickiest to peg here, but is somewhere between 33,760 and 34,300 -- give or take.
Oh, and don't worry about how low the volatility indices (the VIX as well as the VXN) are right now... at least not yet. These low levels are largely the result of general disinterest in trading right now.
On the other hand, once interest is rekindled again, the market must pick up where it left off. The VIX and the VXN are both oddly low right now. Their path of least resistance is higher, which ultimately works against the broad market.
More By This Author:
Weekly Market Outlook - It Coulda Been Worse, But Not By MuchWeekly Market Outlook - The Bulls Are Still In The Fight, But Just Barely
Now, Tuesday's Action Presents More Problems Than Monday's Did


