
Key Market Outlook(s) and Pick(s)
On Tuesday, I joined Nicole Petallides on Schwab Network to discuss Markets, Outlook, Mid-term cycle, Mag 7, $SWK, $NOV, and a lot more. Thanks to Nicole and Althea Thompson for having me on.
Bank of America Fund Manager Survey Update
On Tuesday, we put out a summary of the monthly Bank of America “Global Fund Manager Survey.” This month they surveyed 227 institutional managers with ~$646B AUM:
Here were the 5 key points:
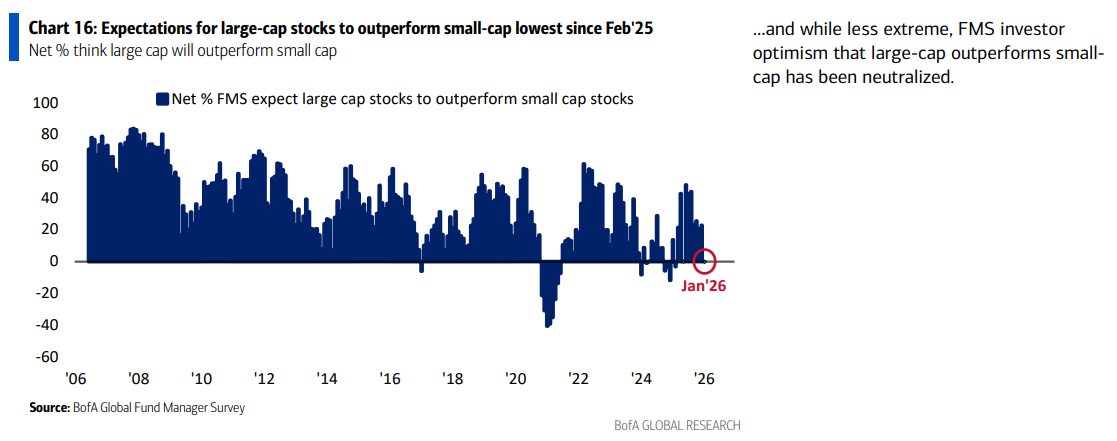
1) Fund manager expectations for large caps to outperform small caps have fallen to their lowest level since February ’25, dropping from a net 23% last month to neutral at 0% this month. This rotation is still in the very first inning…
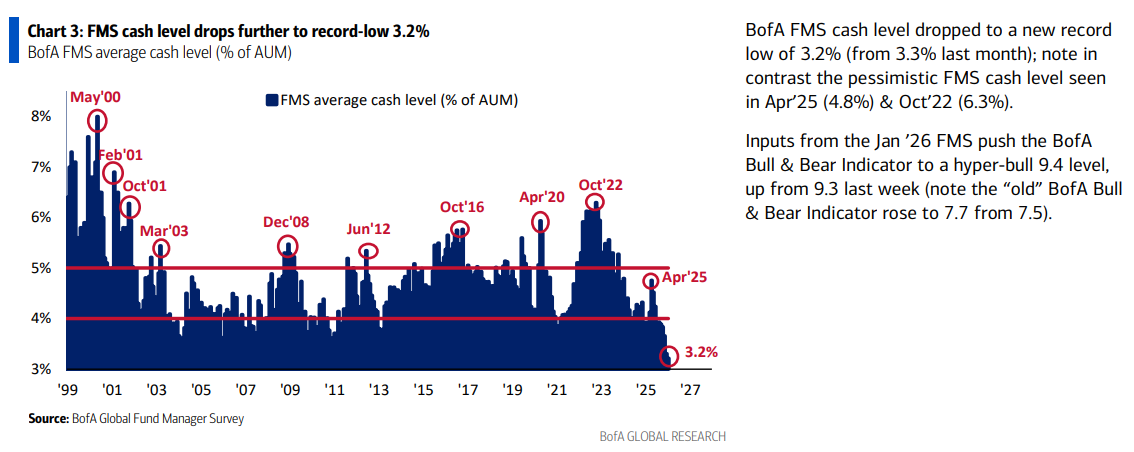
2) Fund managers’ average cash levels dropped to a new record low of 3.2%, down from last month’s 3.3%, pushing the BofA Bull & Bear indicator to stretched levels at a hyper-bull reading of 9.4.
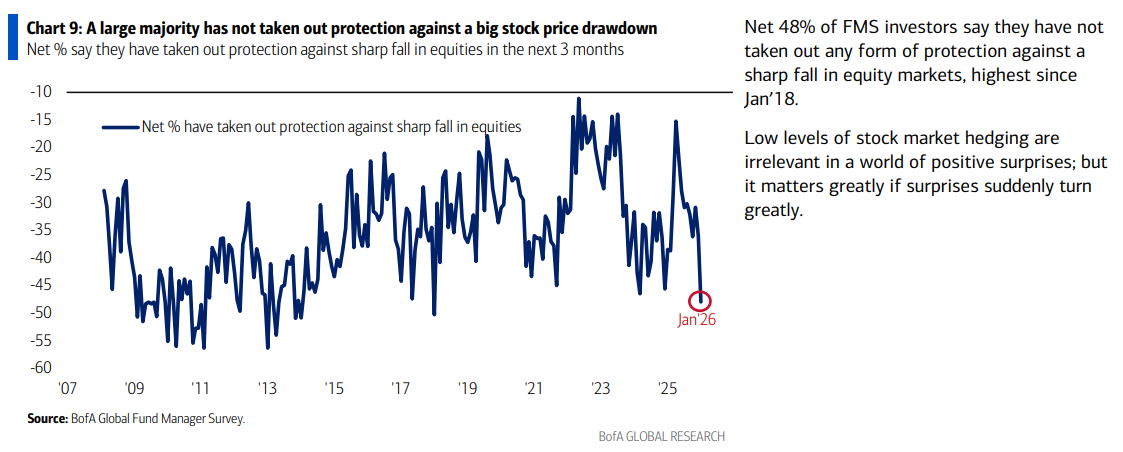
3) Fund managers’ protection against an equity correction over the next three months has fallen to its lowest level since January ’18, with a net 48% now unhedged. As we usually see when markets hit speed bumps, investors will start buying fire insurance after the flames appear.
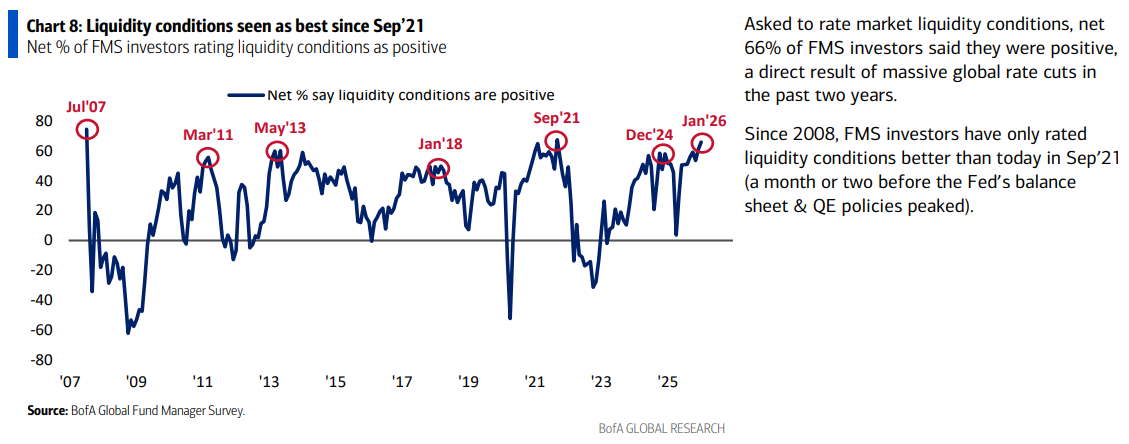
4) Liquidity conditions are now seen as the best since September ’21, with a net 66% of fund managers viewing conditions as positive. Excluding September ’21, this is the highest reading since 2008, driven by the global easing cycle and the return of QE tailwinds.
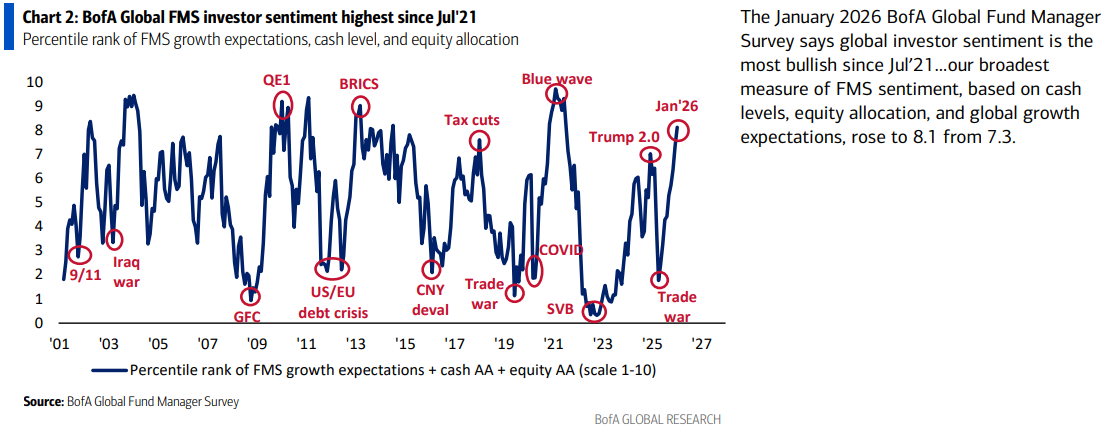
5) Fund manager sentiment, based on cash levels, equity allocations, and global growth expectations, rose to 8.1 from last month’s 7.4, the most bullish reading since July ’21. With sentiment at these stretched extremes, this is exactly why we have been making the case to “curb your enthusiasm” and be selective. Expect some near-term volatility, typical of a mid-term year, to shake out the weak hands.
Comstock Resources Update
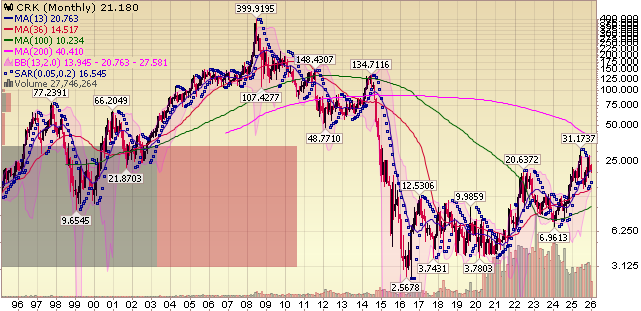
While shares have recovered meaningfully since we began building our position in 2023, we continue to view Comstock Resources as the cleanest, leveraged play on what we believe is the very early innings of a secular natural gas super cycle. Nat gas is the true pick-and-shovel, backdoor trade behind the AI and data center buildout, and no company is better positioned to benefit than Comstock.
What makes the setup even more compelling is the fact that you still can’t give away the energy sector. Fund managers sit nearly two standard deviations underweight, with the sector making up a near record-low ~2.8% of the S&P 500. If history is any guide, these kinds of dislocations have consistently marked generational buying opportunities.
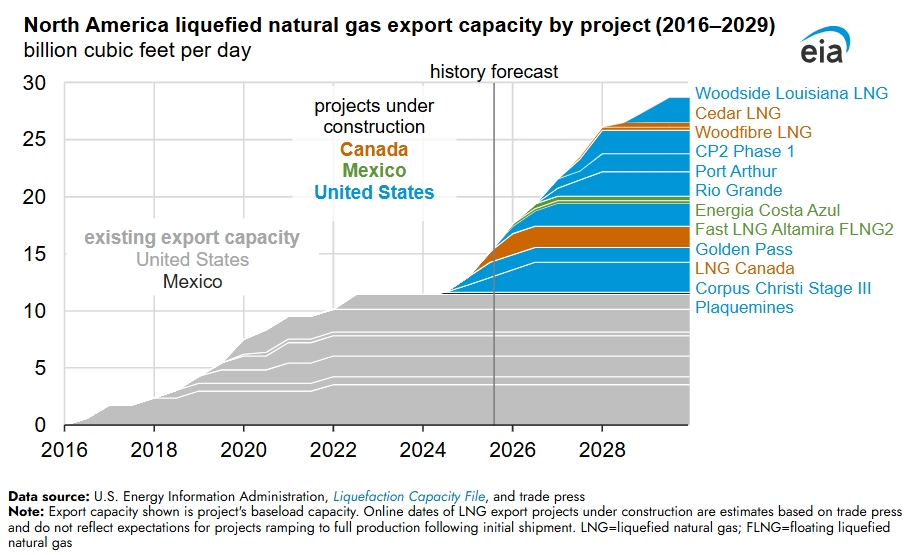
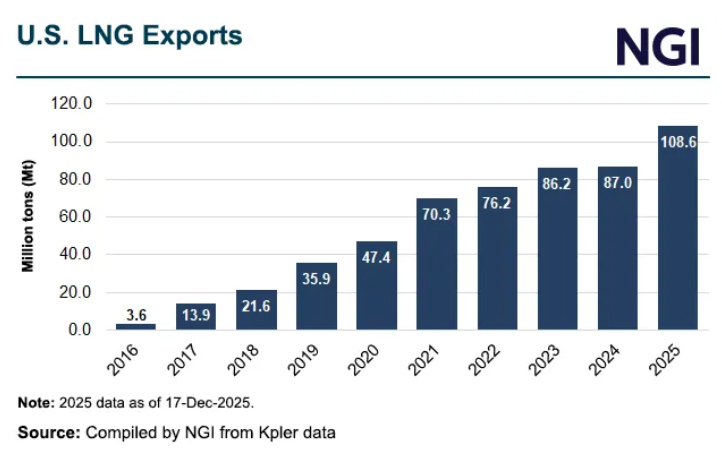
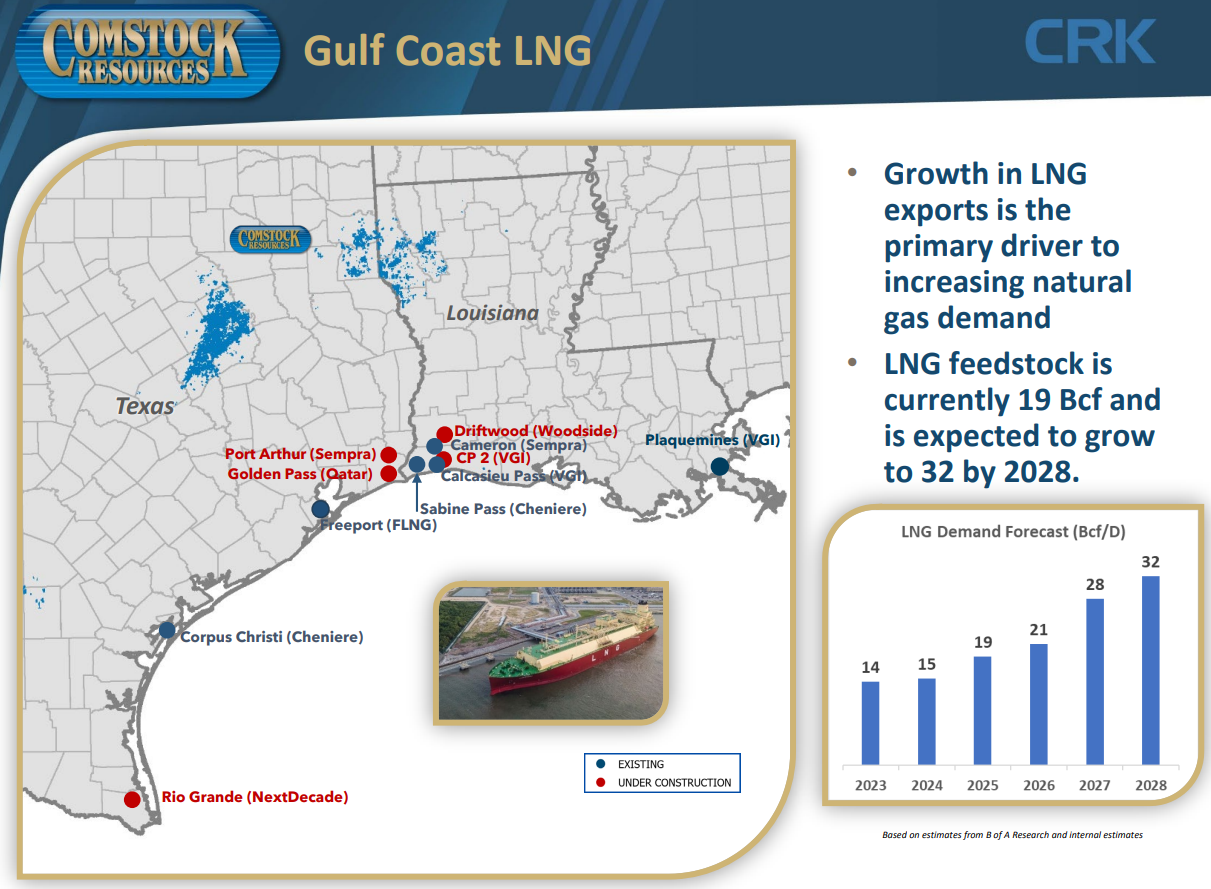
In the case of Comstock, investors are getting a twofer of structural demand tailwinds. LNG exports remain the primary long-term driver for natural gas demand, with North American capacity set to more than double over the next three years. In fact, the US set a record in 2025 as the first country to export over 100 million metric tons of LNG in a single year, a trend we expect to continue.
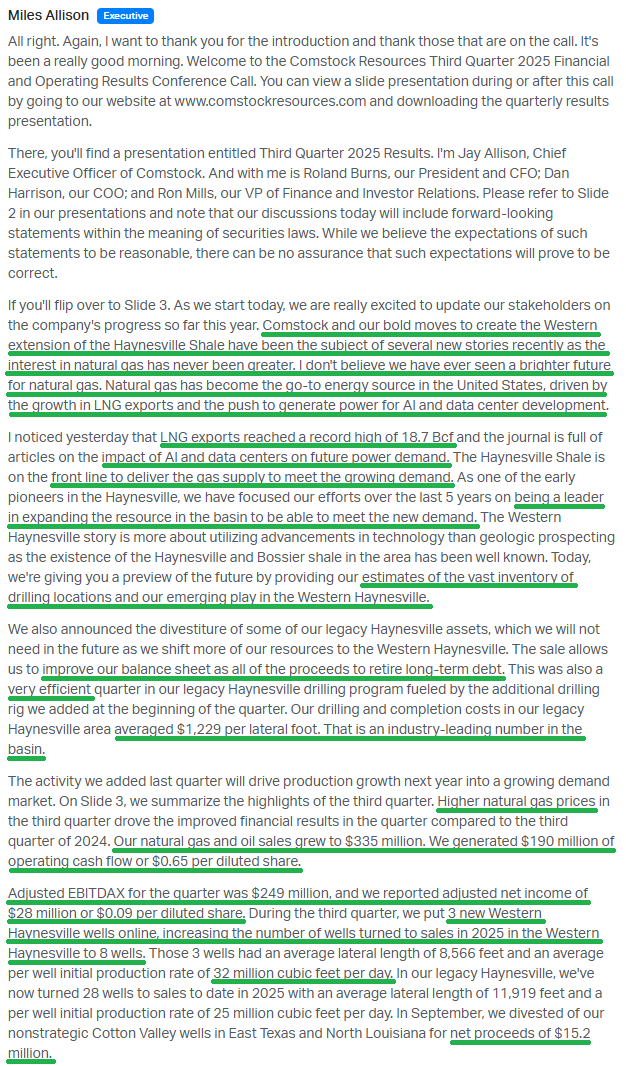
Overlaying this export demand is the accelerating power demand from AI and data centers, which is emerging as a massive new source of incremental gas demand. So while investors continue to debate whether AI is transformational or overhyped, one fact is unavoidable. It needs power like a diabetic needs insulin. And power increasingly means natural gas. As management put it, “I don’t believe we have ever seen a brighter future for natural gas.”
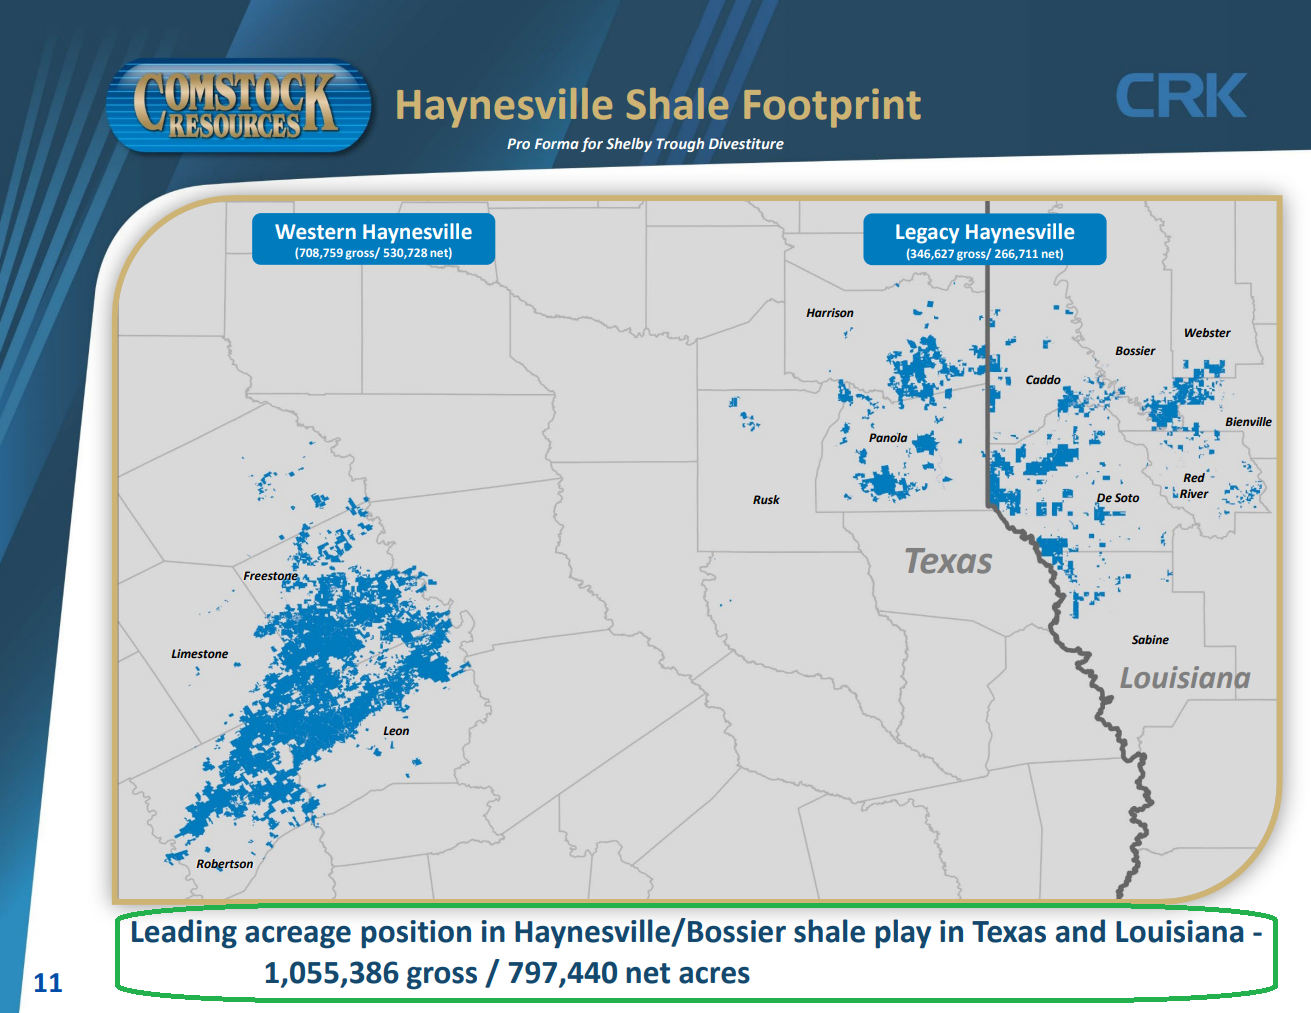
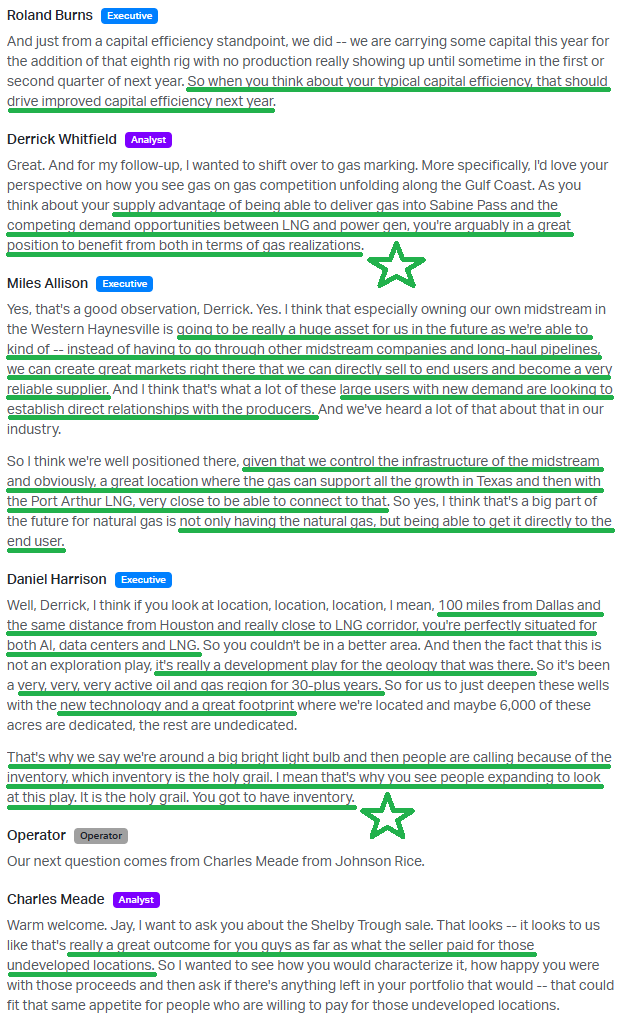
Comstock is a prime beneficiary of these tailwinds. The company maintains the industry’s leading cost structure, ~50% below peers, and more importantly, it controls what we see as the most advantaged footprint in the country. Its acreage in the Haynesville sits close to the Gulf Coast LNG export terminals and only ~100 miles from both Dallas and Houston, prime locations for hyperscaler data centers.
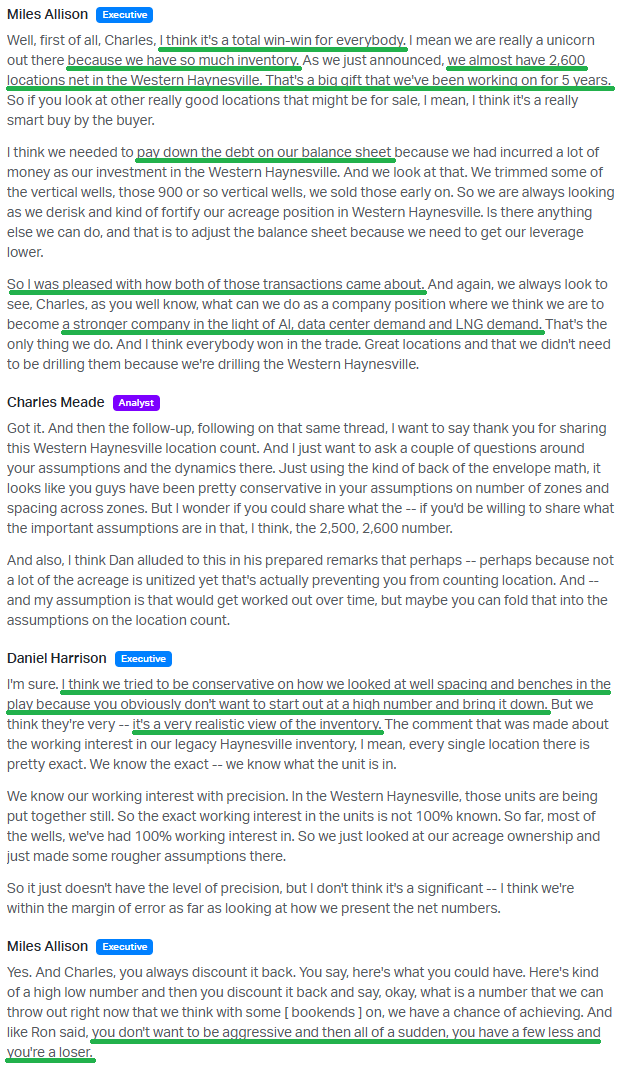
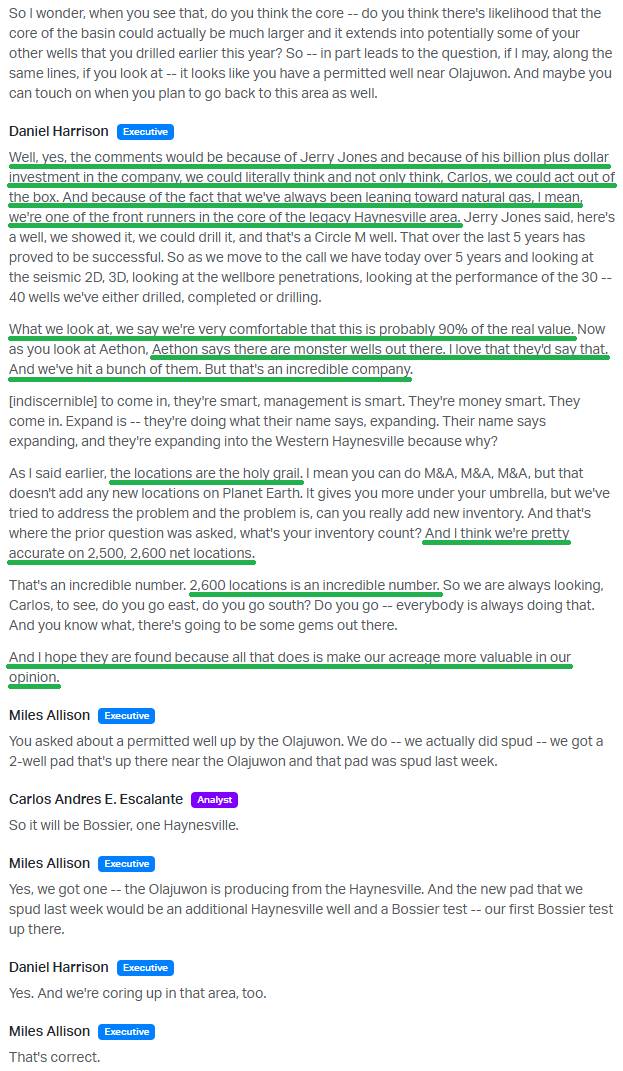
Even more important is what management has been quietly building over the past five years. With the backstop of majority owner Jerry Jones, the veteran wildcatter and Dallas Cowboys owner who controls about 71% of the company (with over $1 billion invested), Comstock played offense while gas prices were in the doldrums. While other producers were hiding under their desks, Comstock took the Buffett approach of buying when there was blood in the streets, building out over 530,000 net acres in the Western Haynesville, what management now calls the “holy grail.”
For the first time, management disclosed the play’s inventory: nearly 2,600 drilling locations equating to decades of drilling runway and enormous resource potential that Jones believes carries a present value of ~$100B of gas.
Here’s a great interview from just a few months back with CEO Jay Allison and Jerry Jones, touching on one of our favorite themes of “skating to where the puck is going,” why the Comstock story is still in the early innings, and why Jerry Jones believes his investment in CRK “puts the Cowboys in the shade financially.” For context, Comstock’s current market cap is ~$6.6B versus the Dallas Cowboys’ ~$13B valuation…
Q3 Earnings Breakdown
10 Key Points
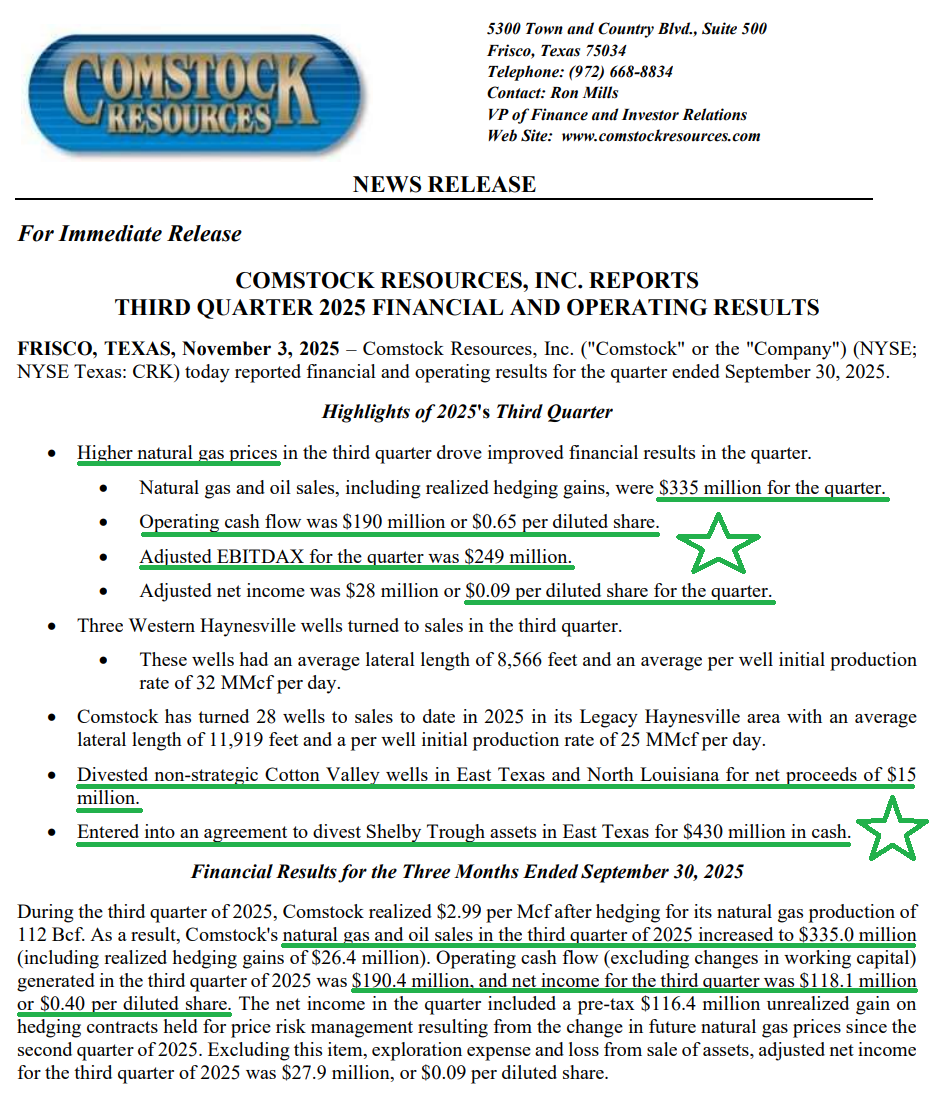
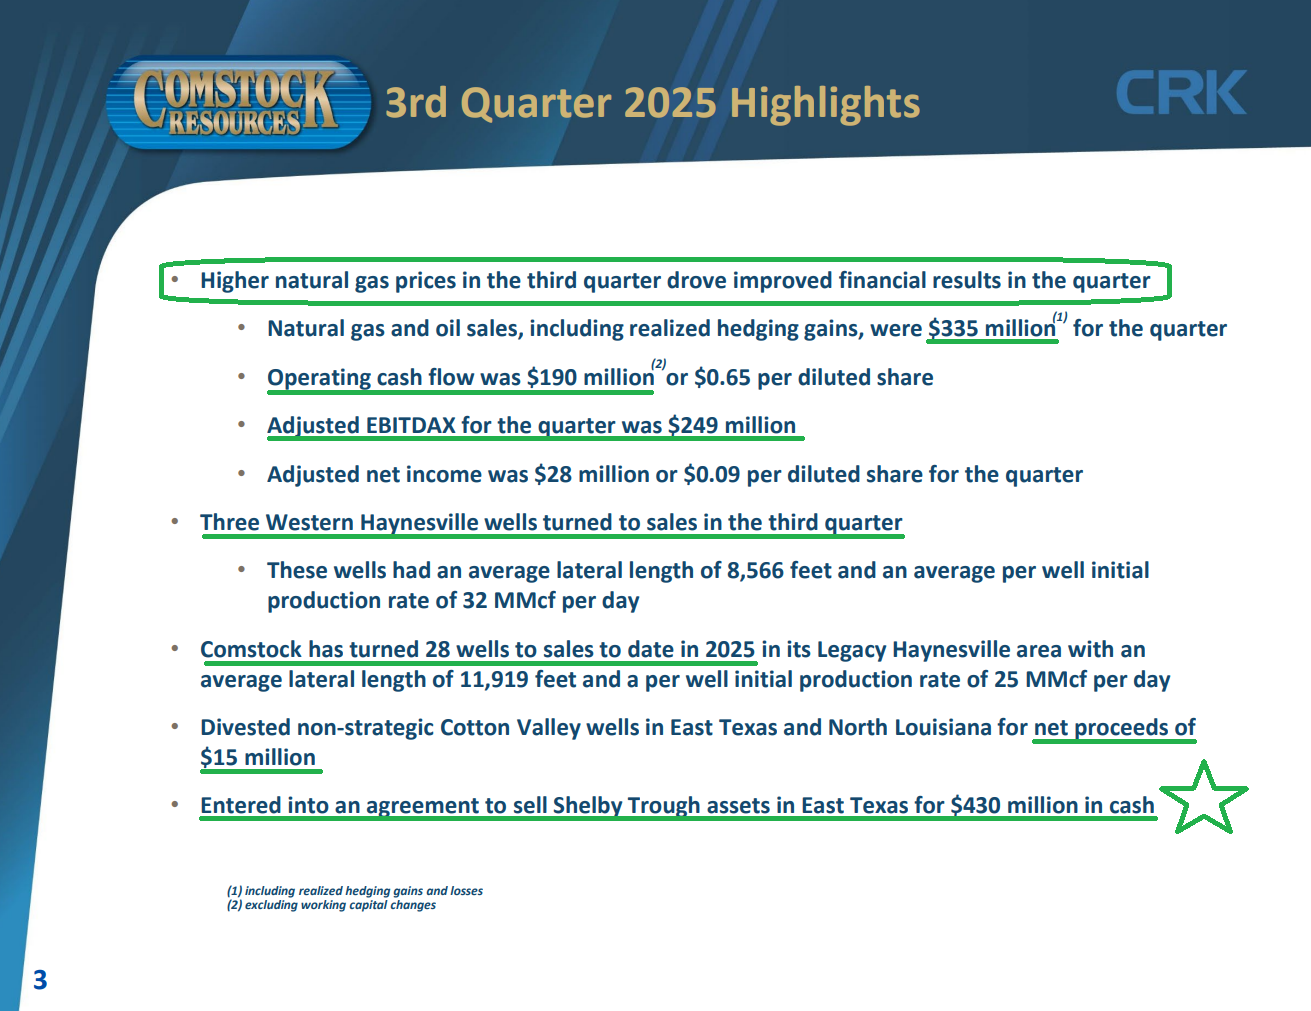
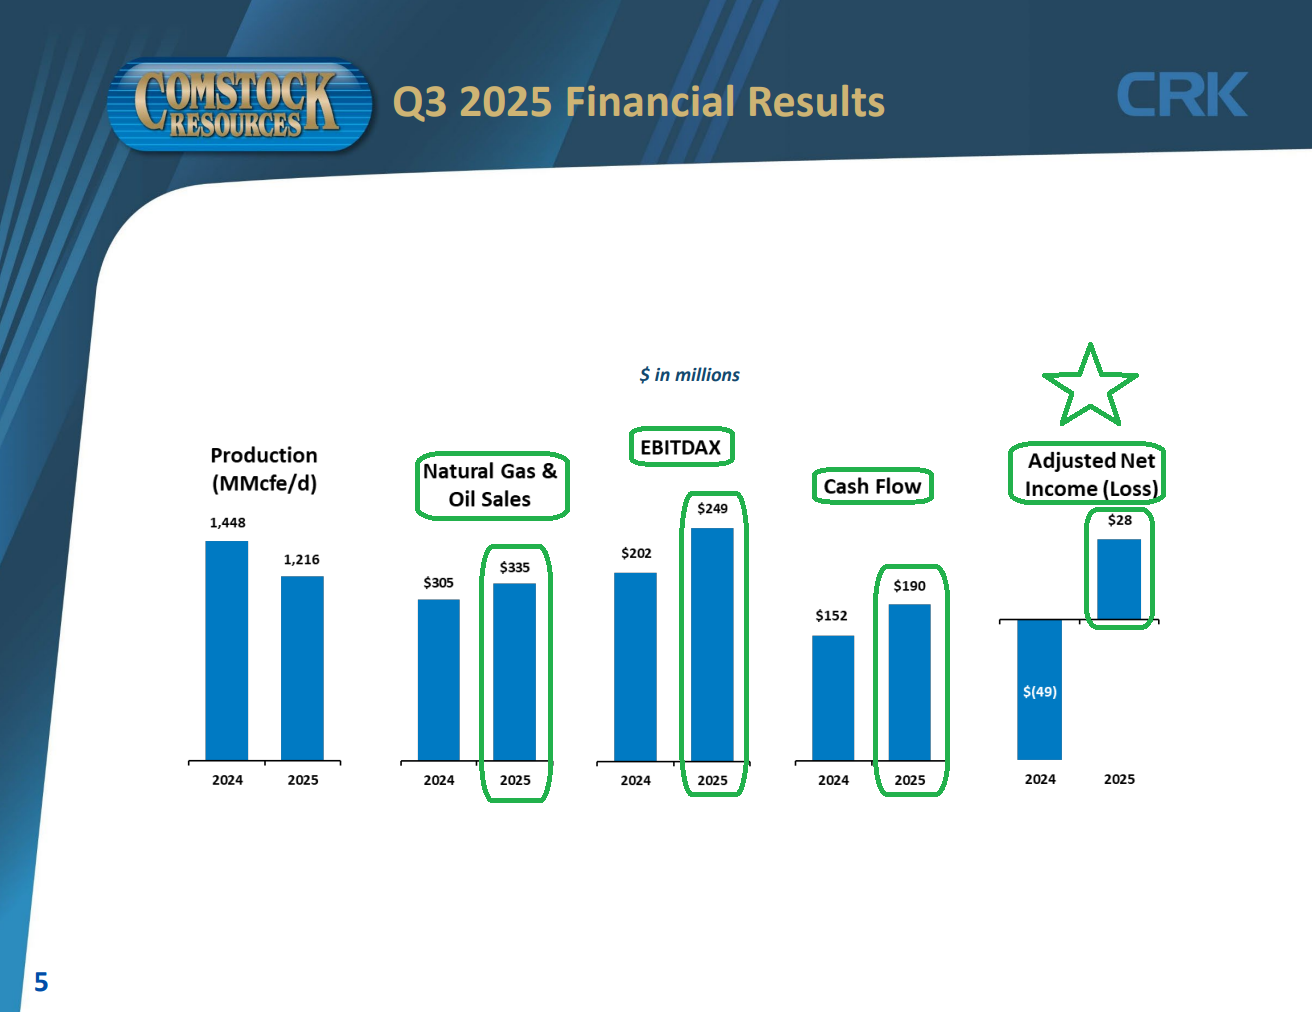
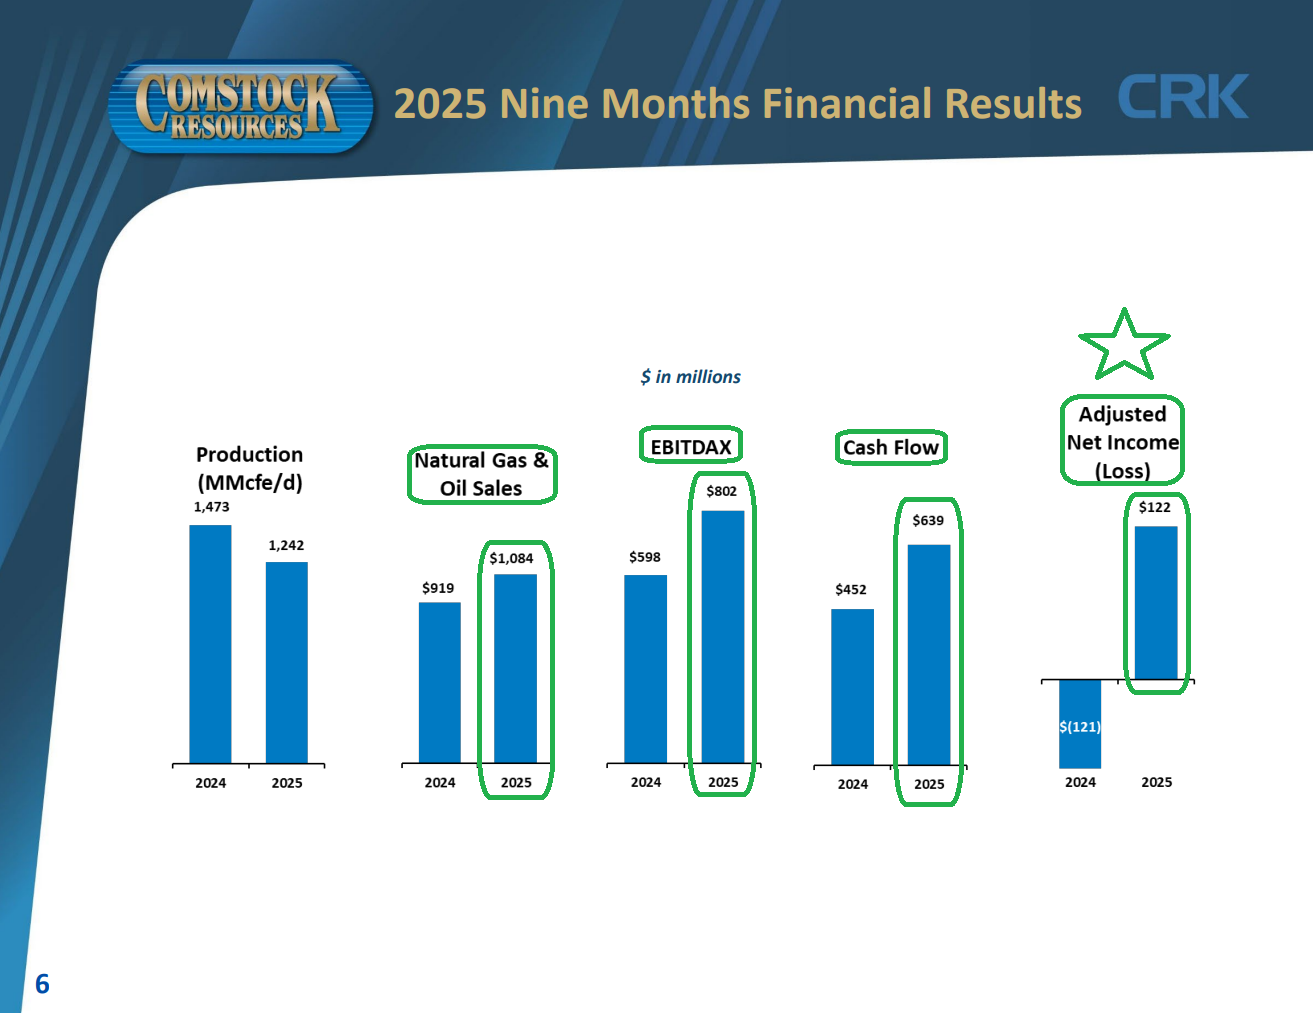
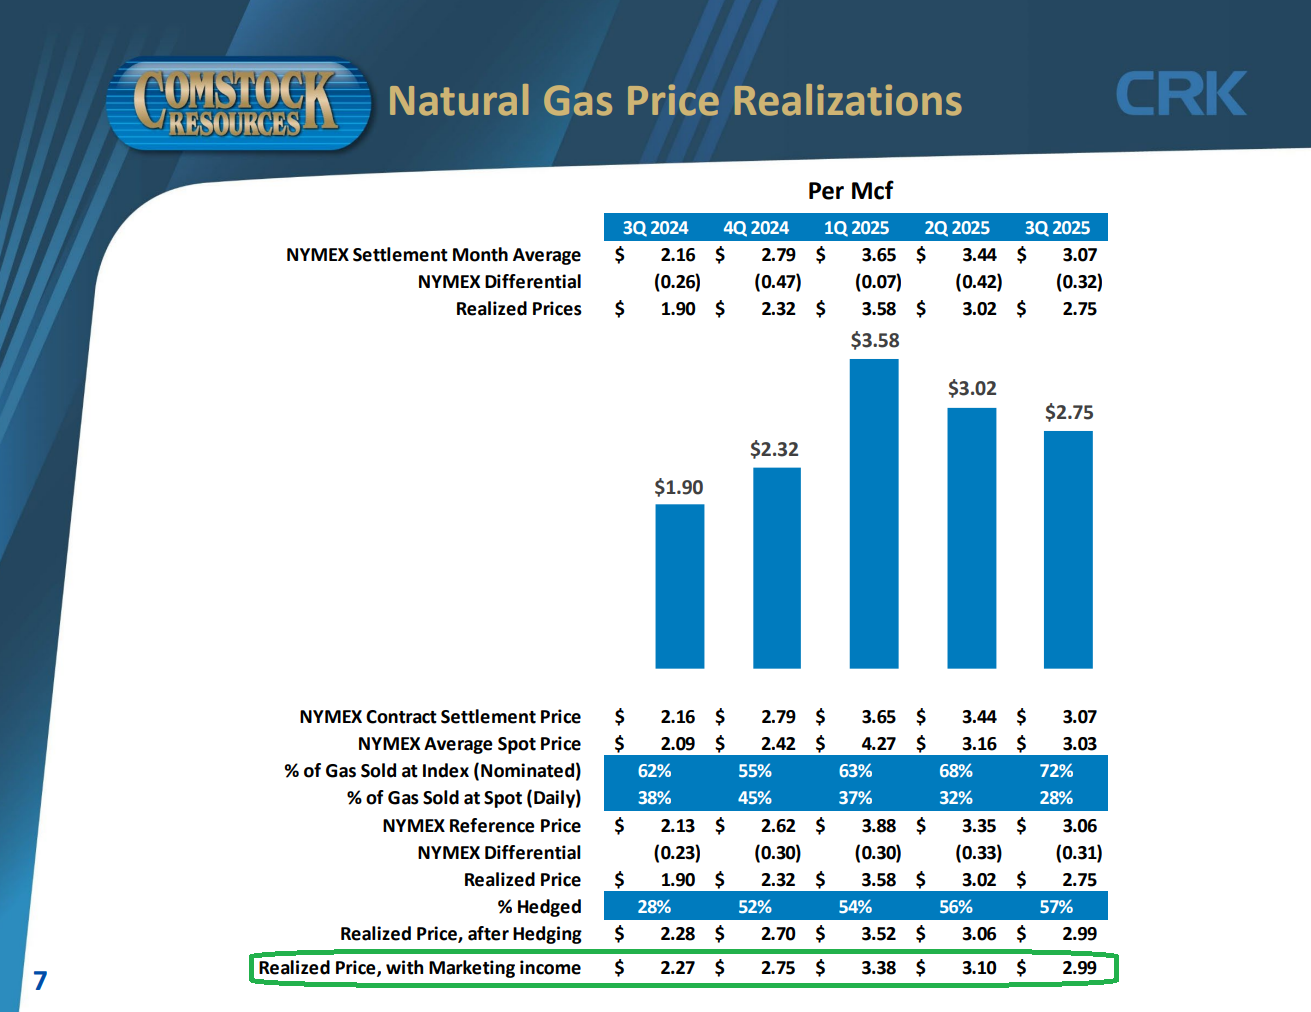
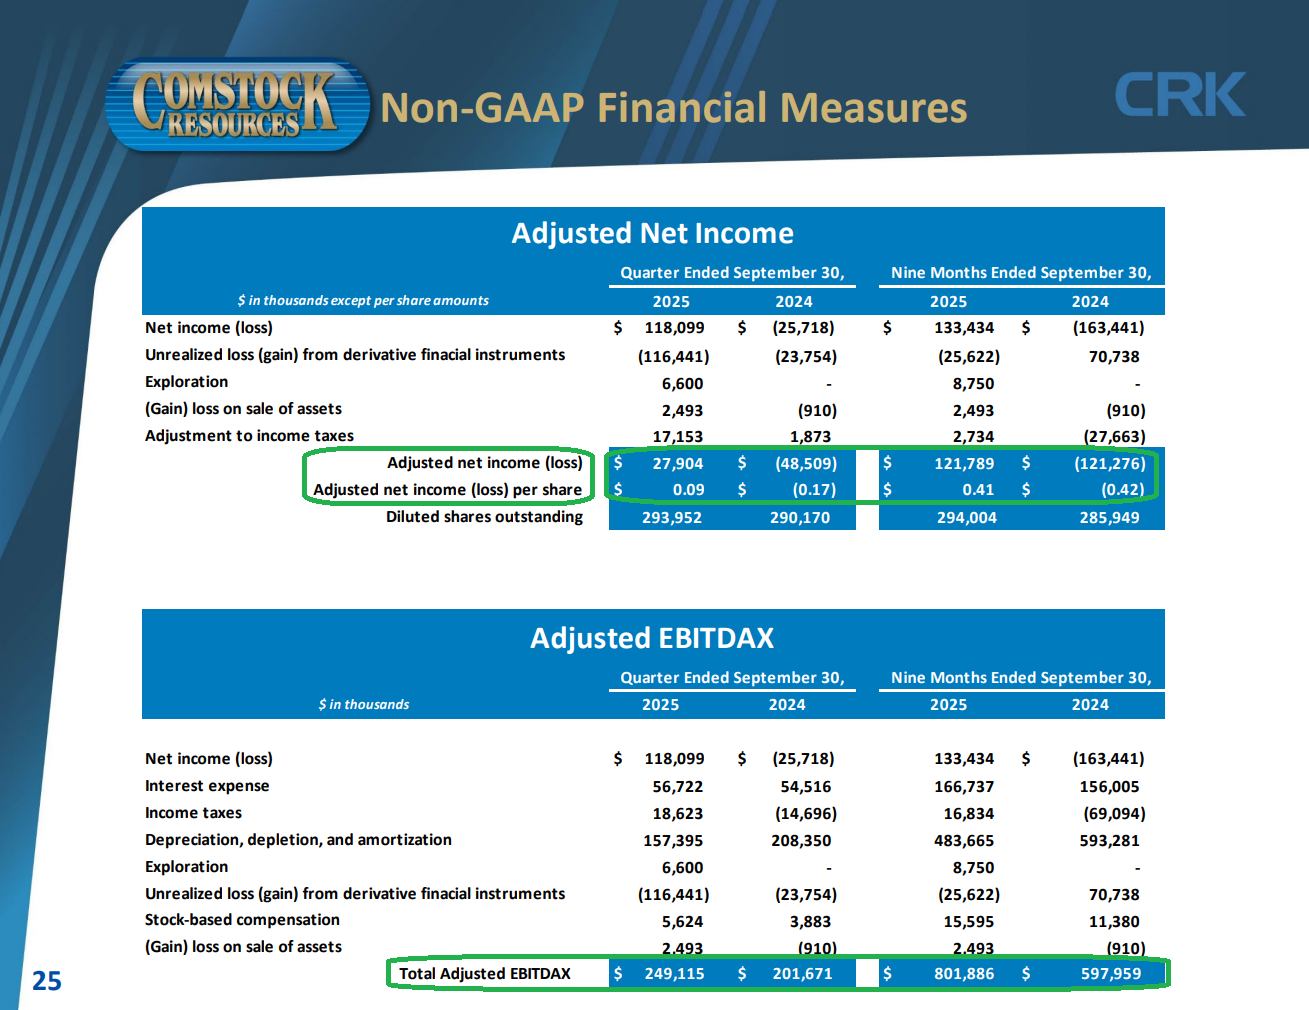
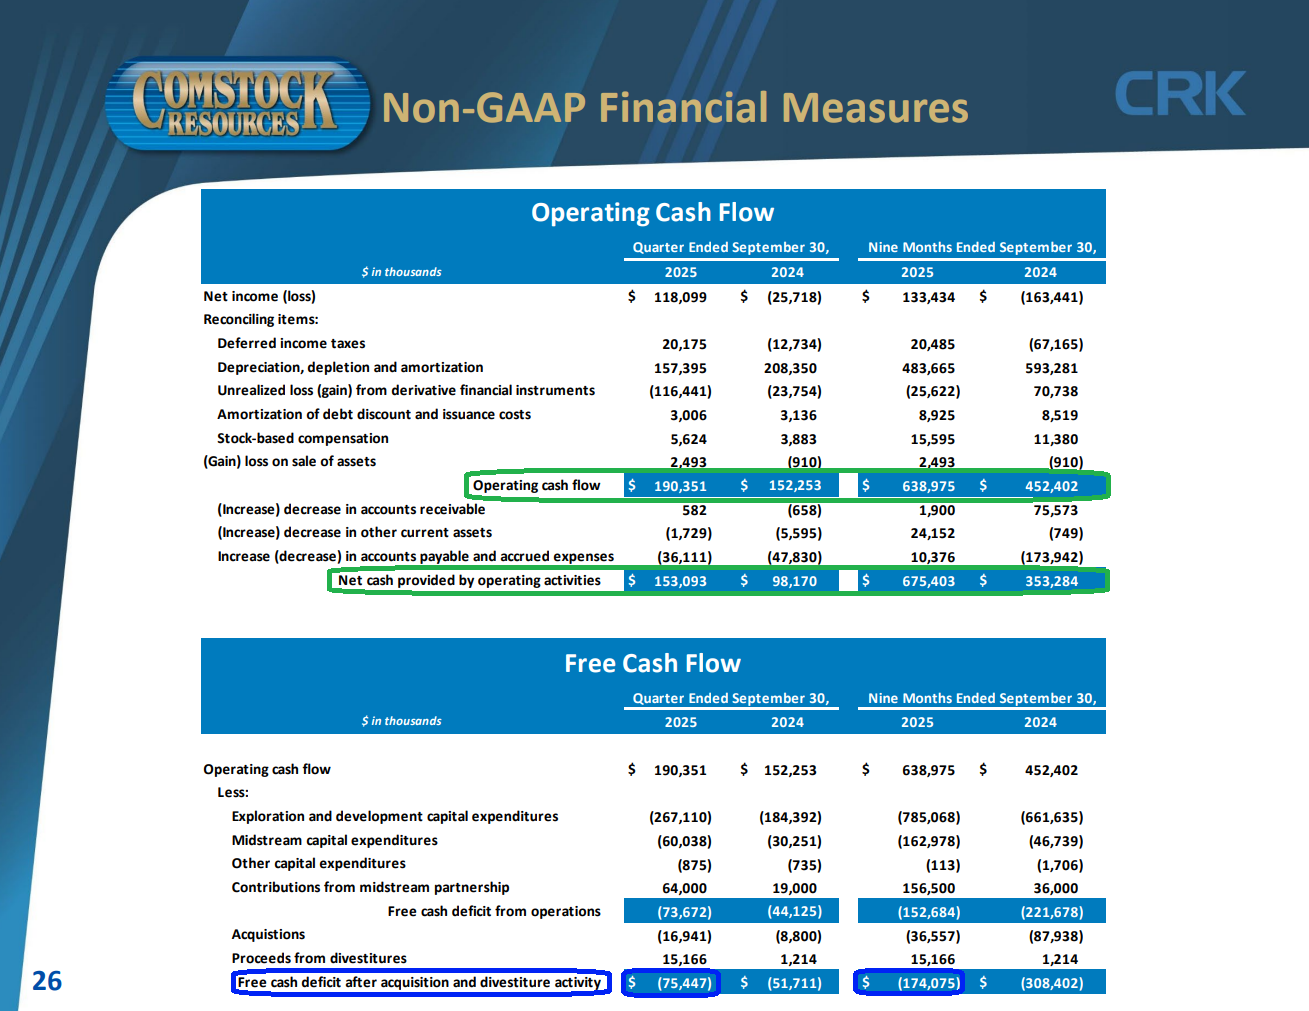
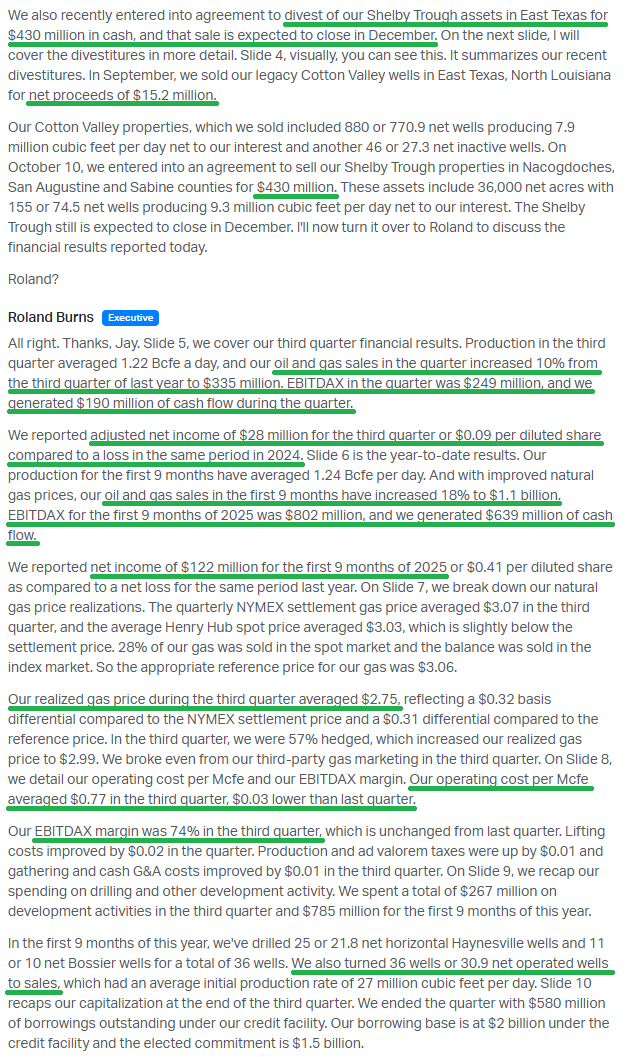
1) Comstock’s natural gas and oil sales totaled $335M in the third quarter (+10% YoY), including $26.4M of realized hedging gains. This brings year-to-date oil and gas sales to $1.1B, up 18% YoY. Results were driven by higher realized gas prices of $2.99 per mcf in Q3 after hedging, bringing the year-to-date realized price to $3.19 per mcf.
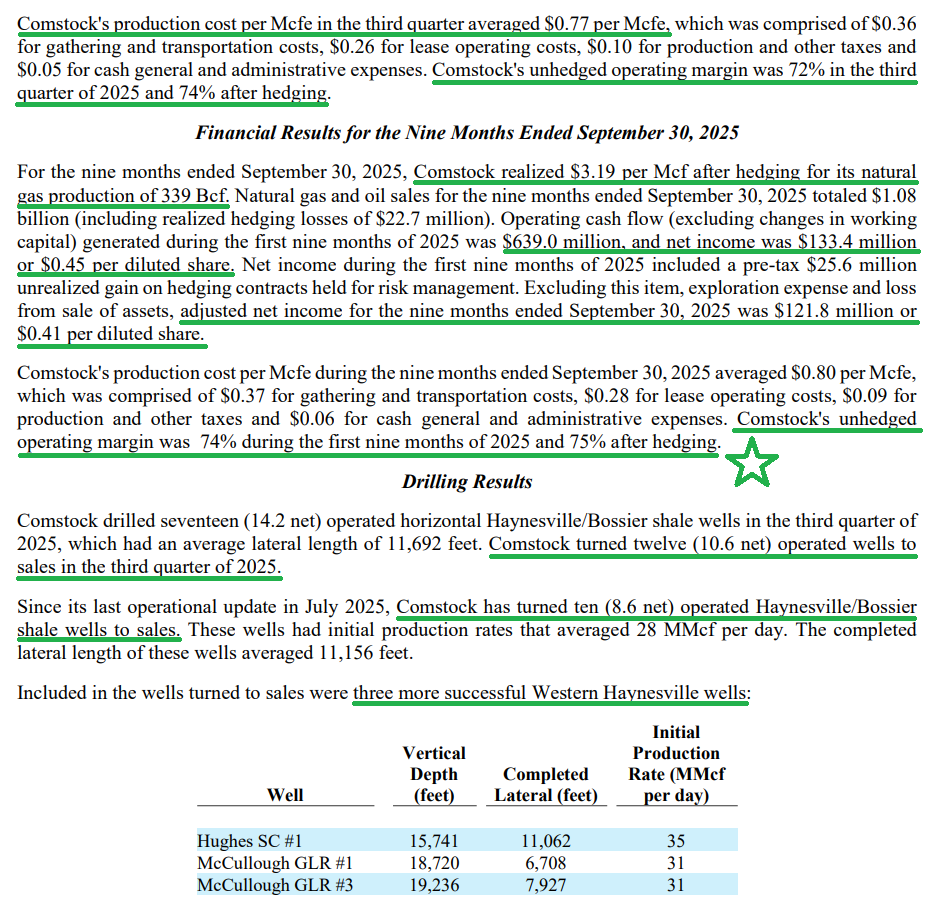
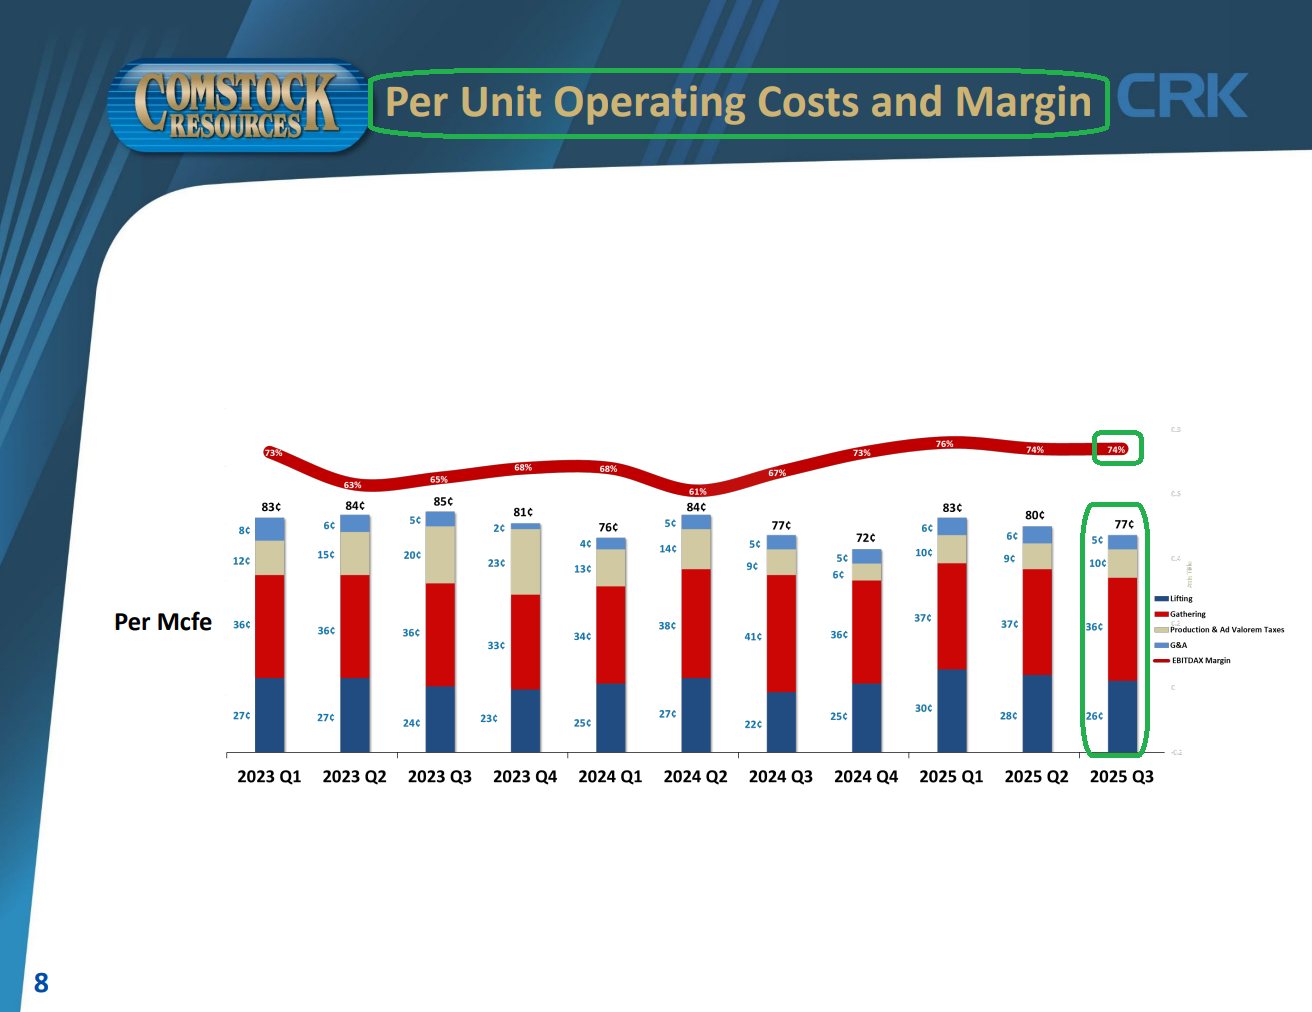
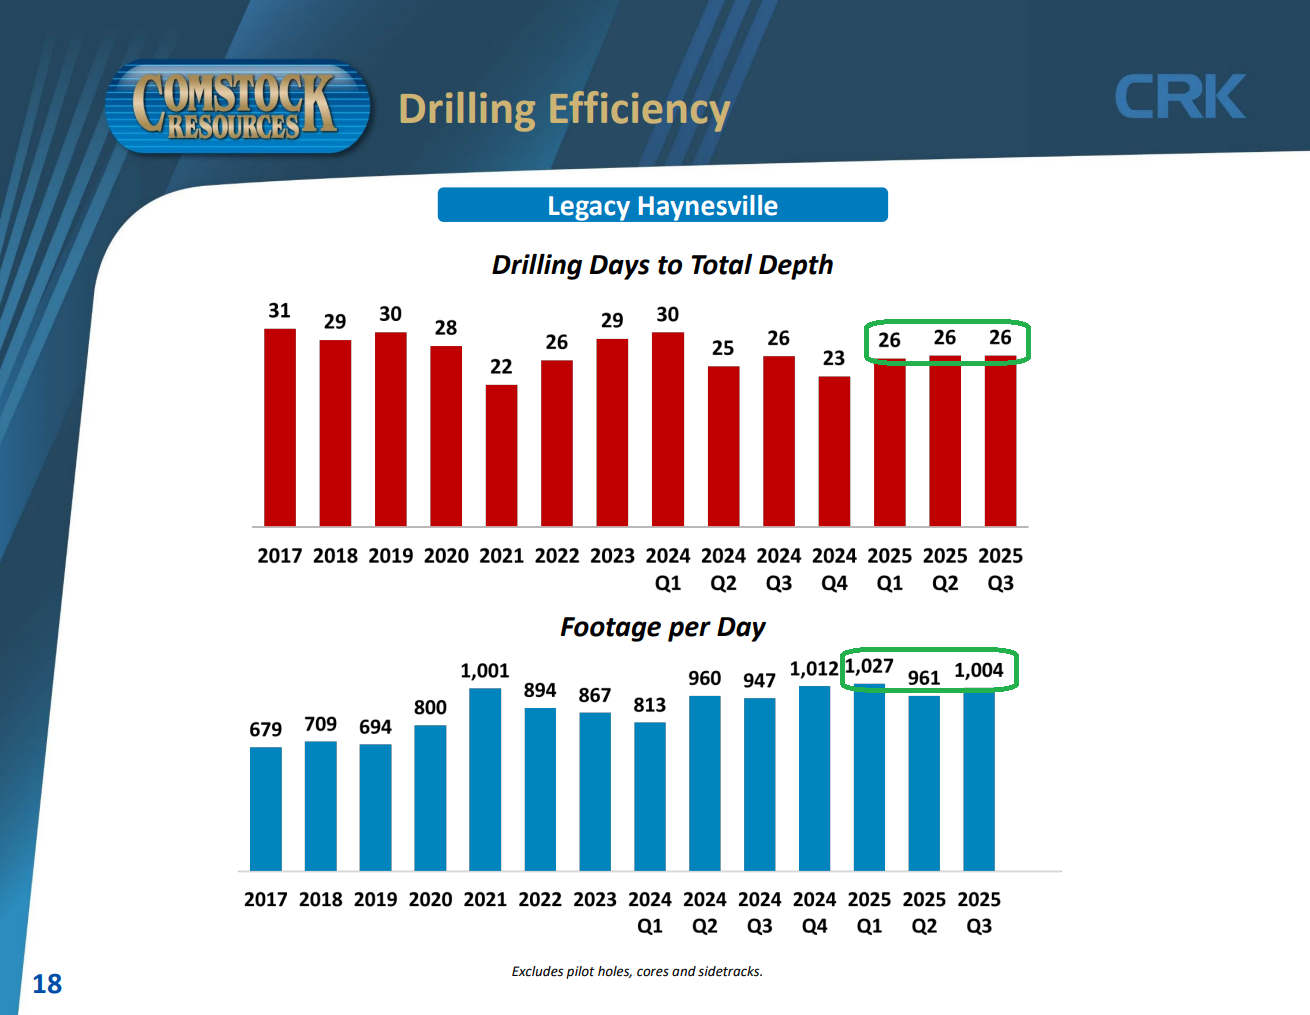
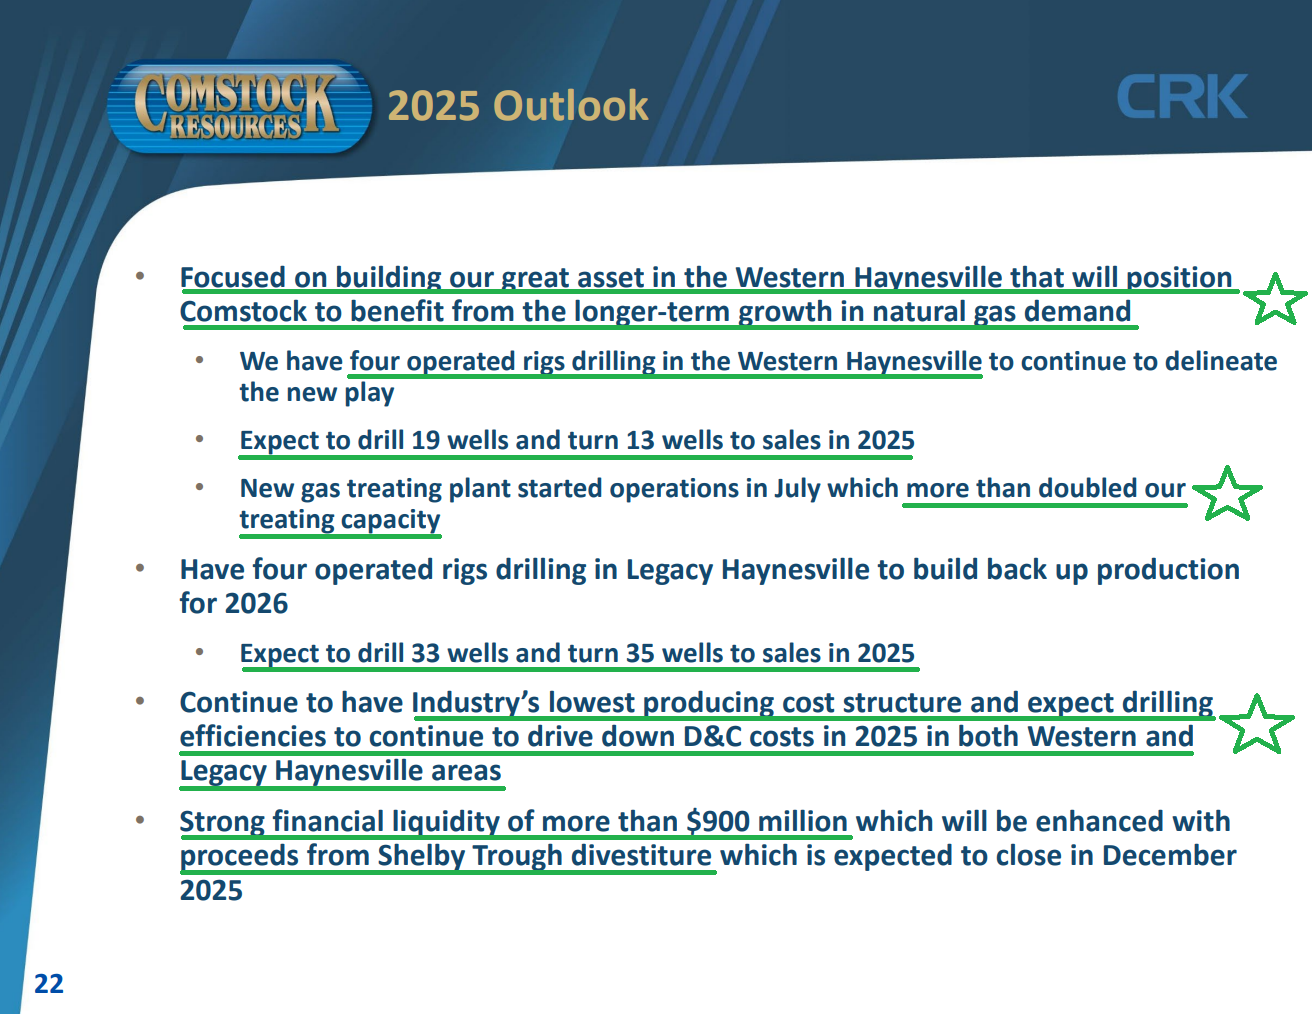
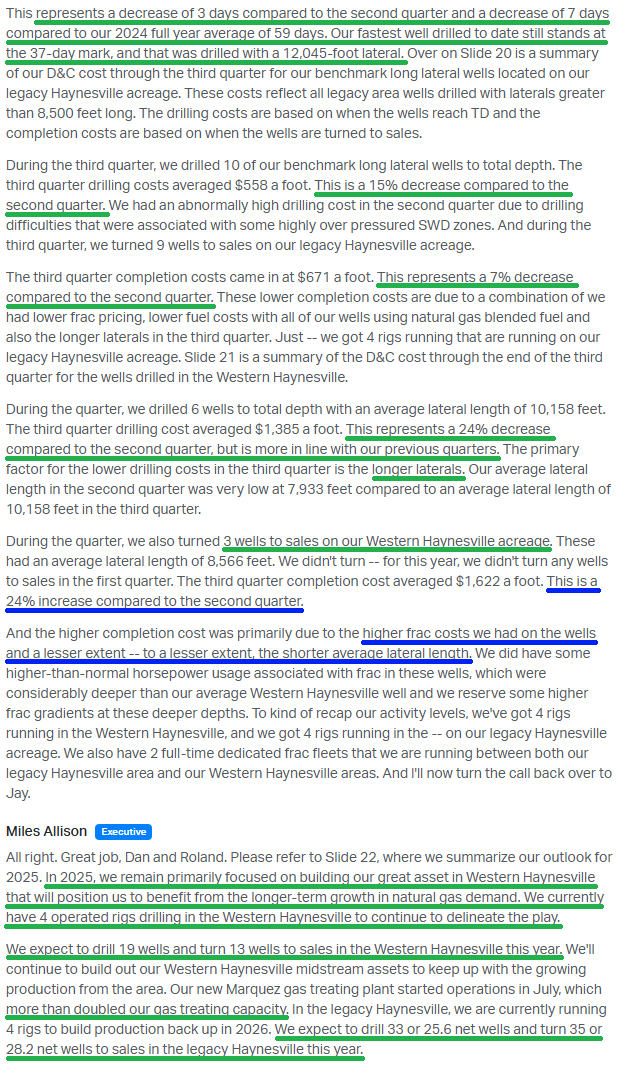
2) CRK continues to maintain its industry-leading low-cost structure, with production costs per Mcfe averaging $0.77 in Q3, down $0.03 sequentially and bringing the year-to-date average to $0.80. Hedged operating margin held steady at 74%, with YTD now at 75%. Management expects further drilling efficiencies to continue driving down D&C costs in 2025 across both Western and Legacy Haynesville.
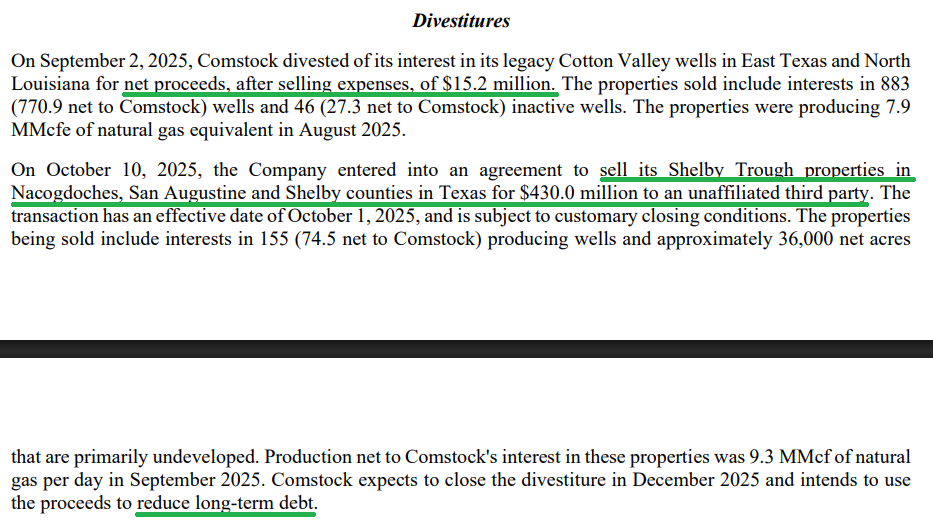
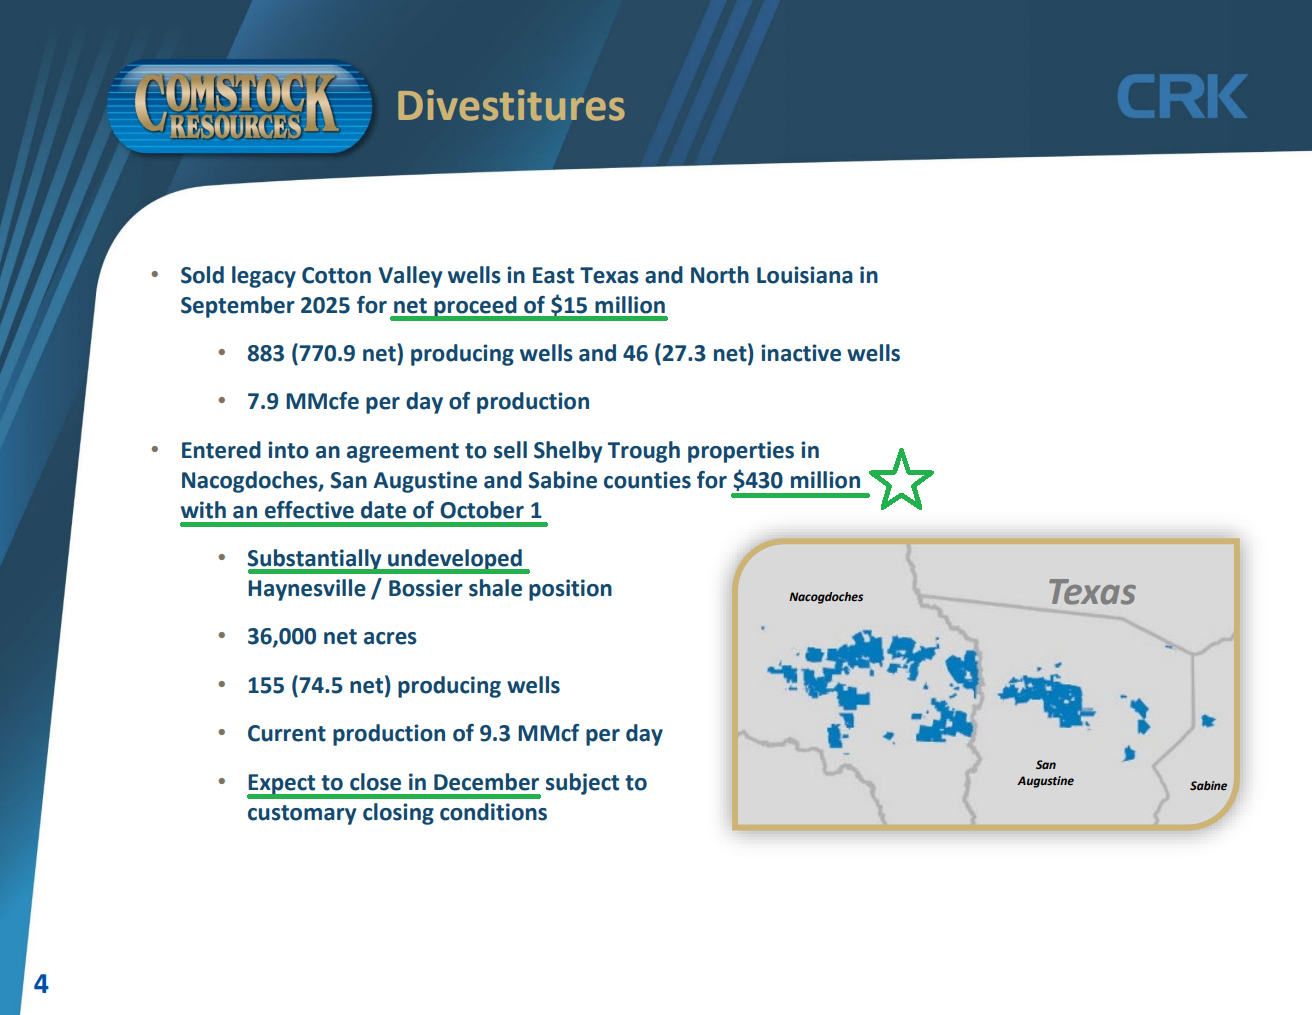
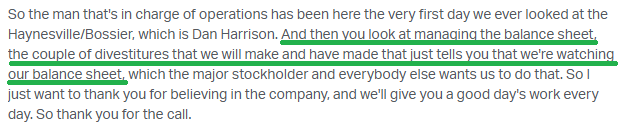
3) Management announced a series of non-strategic divestitures as part of its balance sheet cleanup, including the sale of Cotton Valley wells in East Texas and North Louisiana for net proceeds of $15.2M, as well as an agreement to divest Shelby Trough assets in East Texas for $430M in cash. These assets are substantially undeveloped and generate minimal cash flow, with all proceeds being used to reduce long term debt.
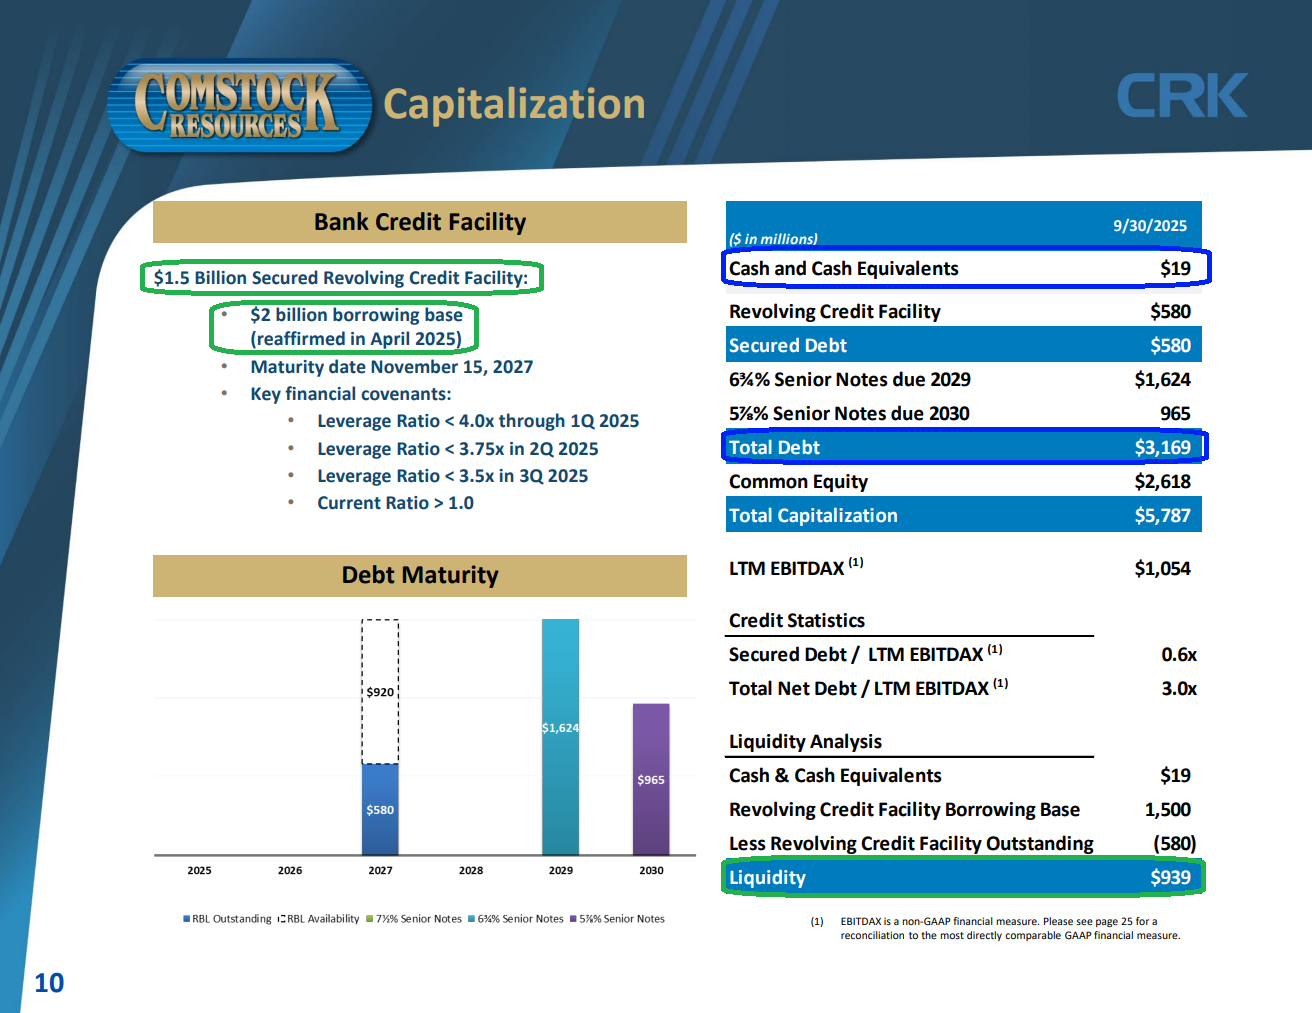
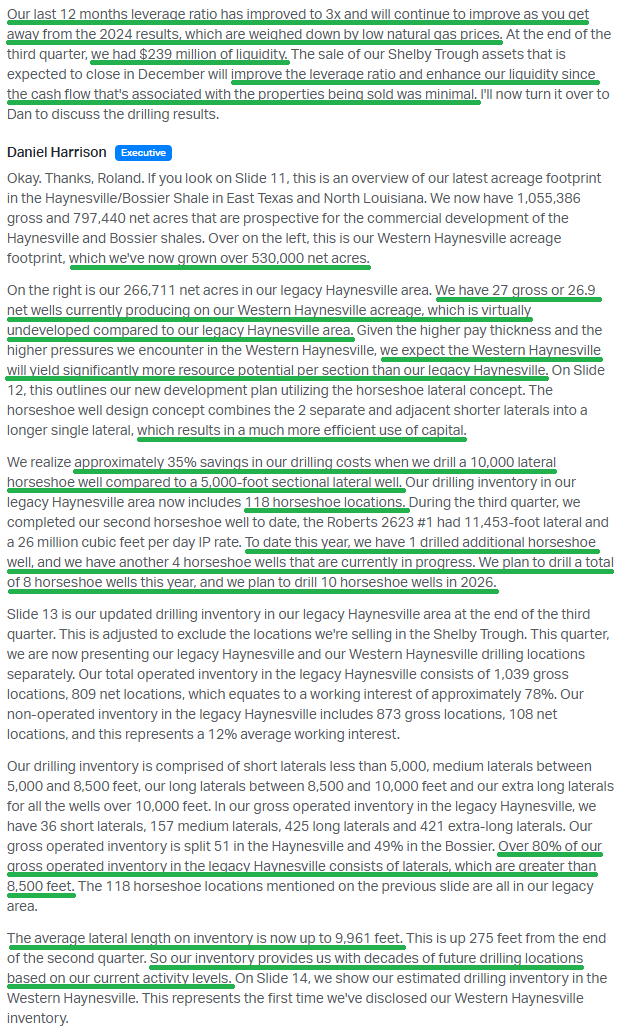
4) Comstock’s net leverage ratio improved to 3x during the quarter and is expected to continue improving as divestiture proceeds are used to retire long term debt. Total liquidity remained strong at $939M, with cash and cash equivalents of $19M against total debt of $3.17B and no maturities until late 2027.
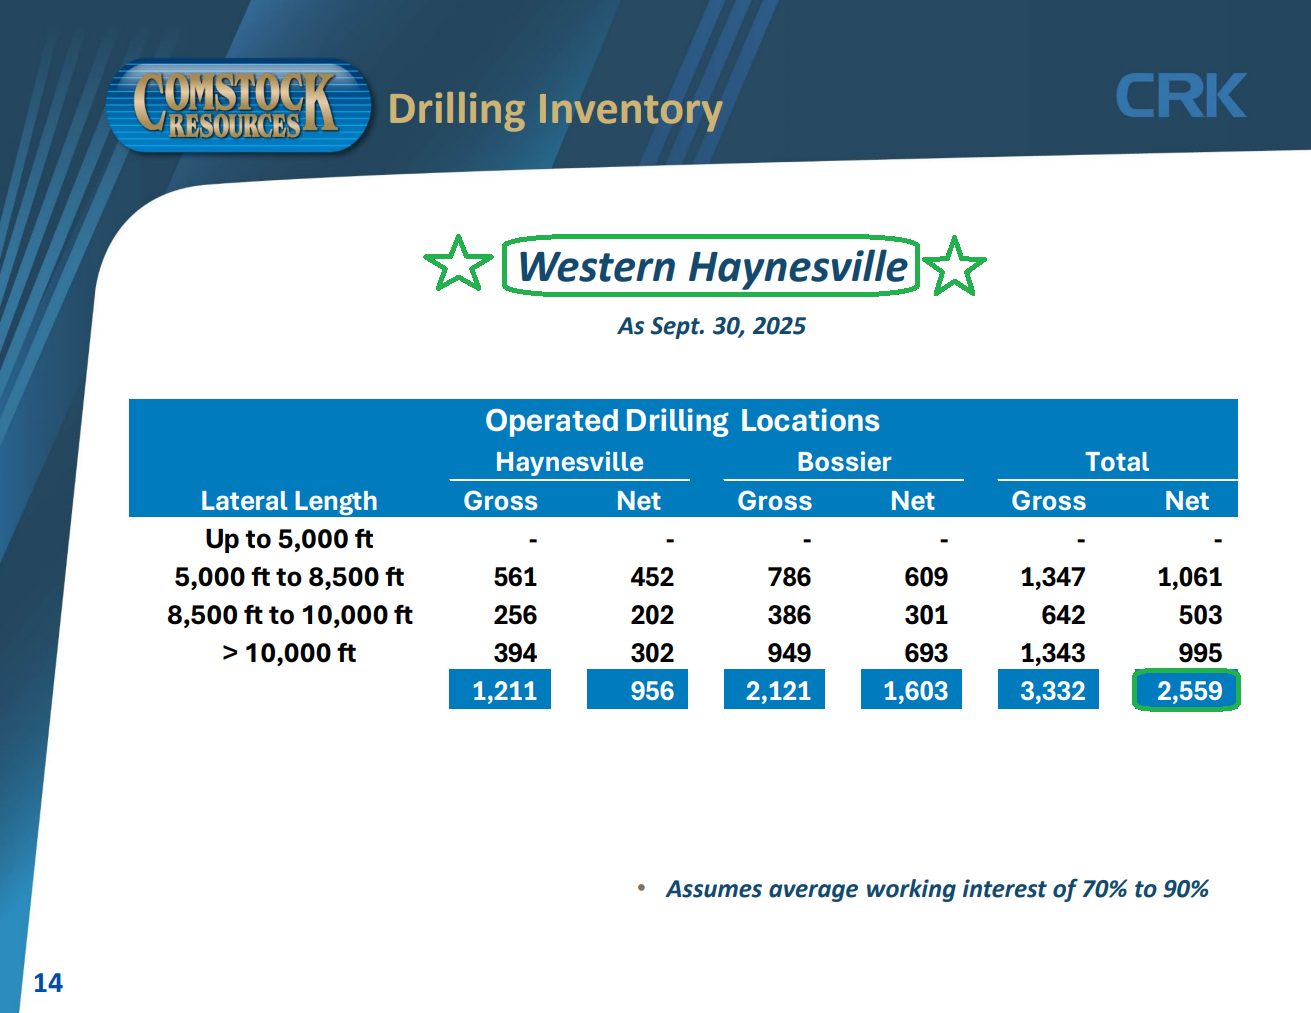
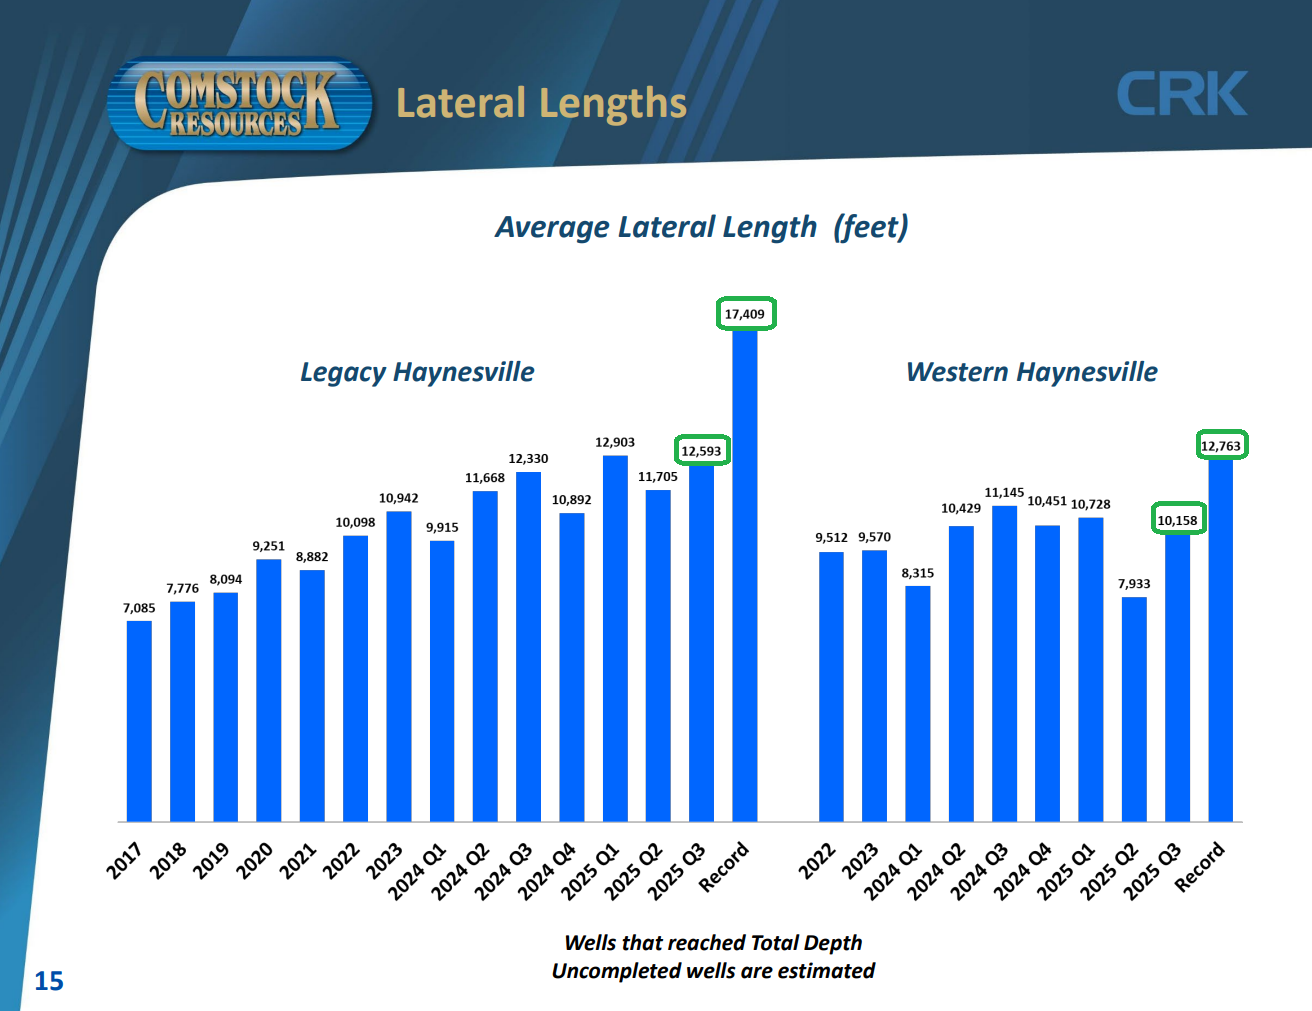
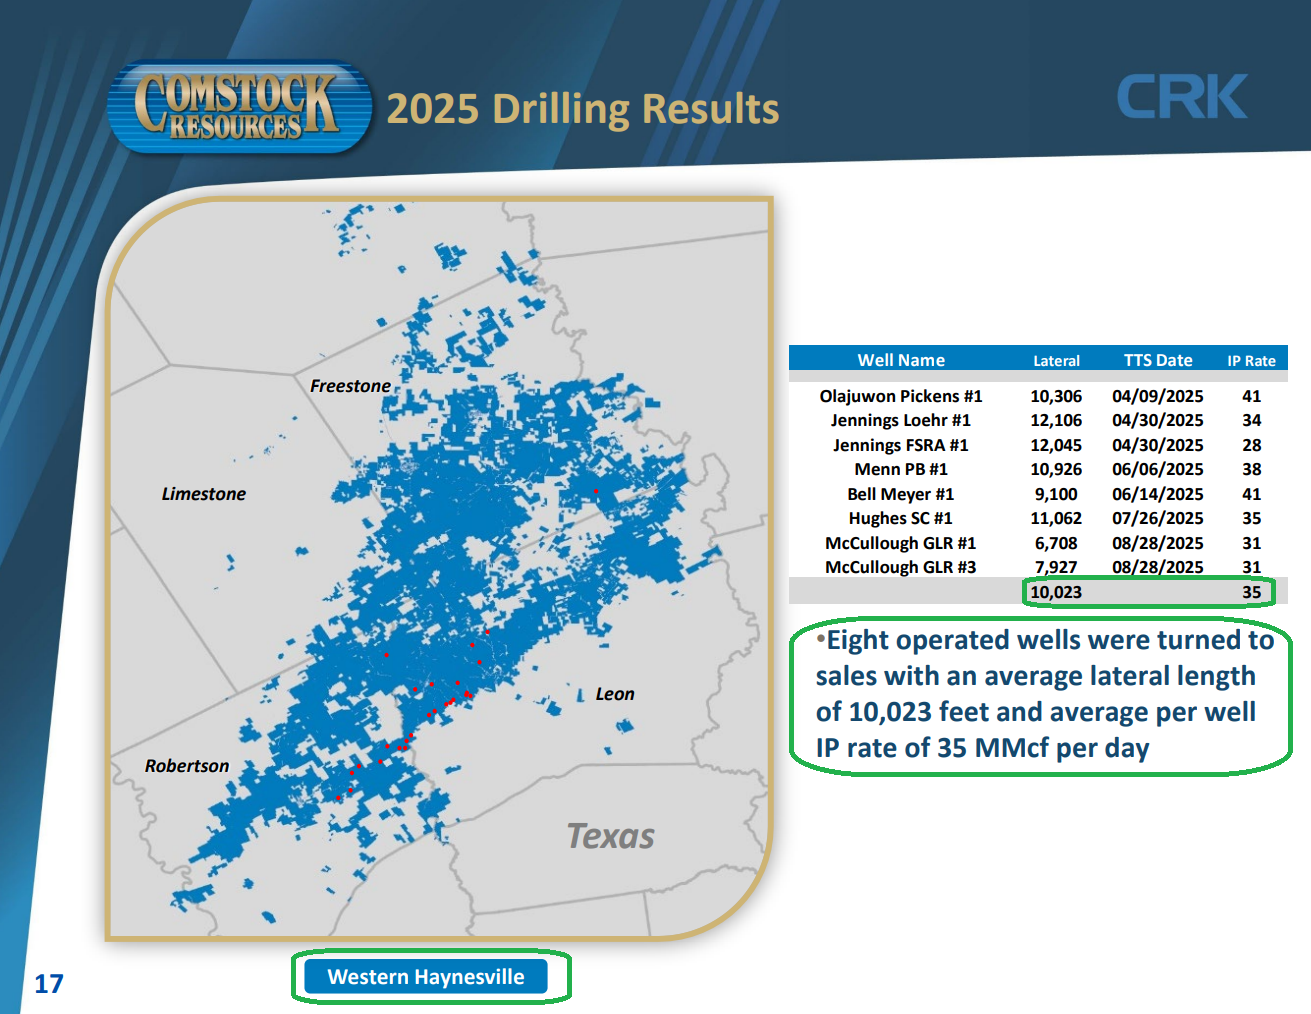
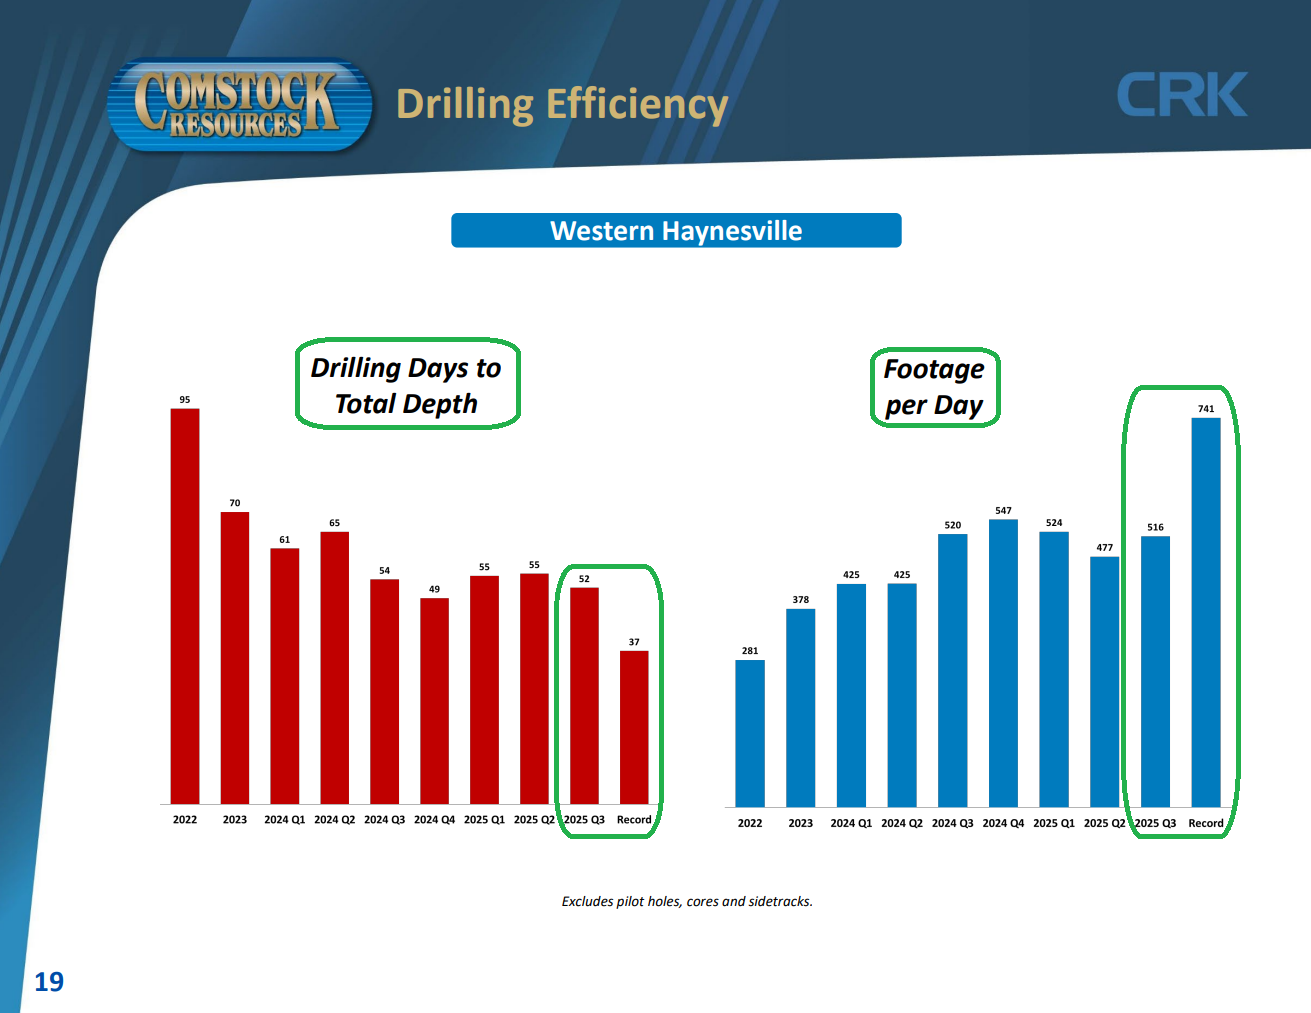
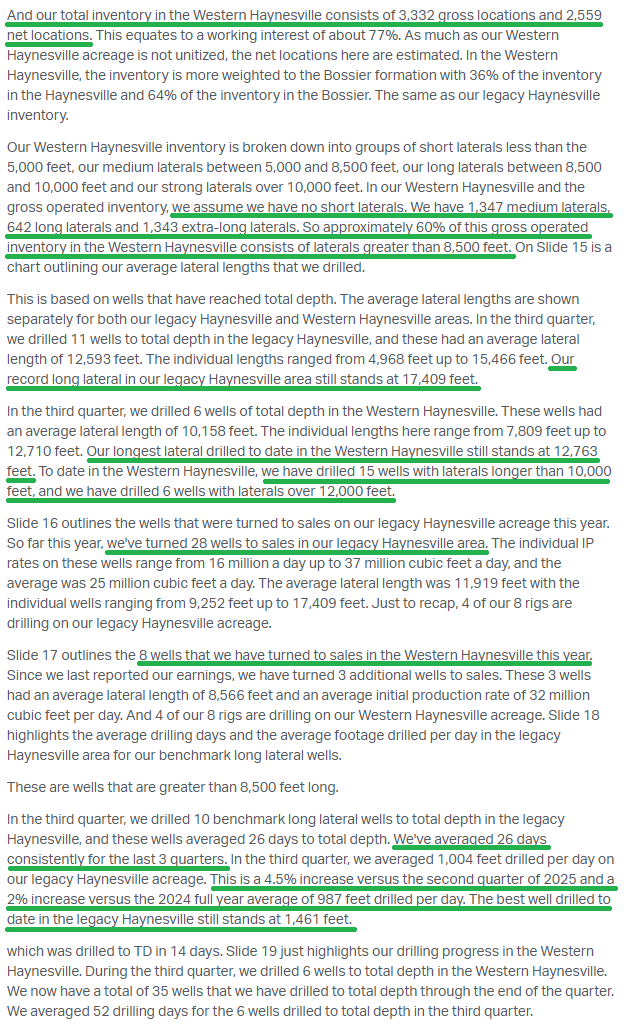
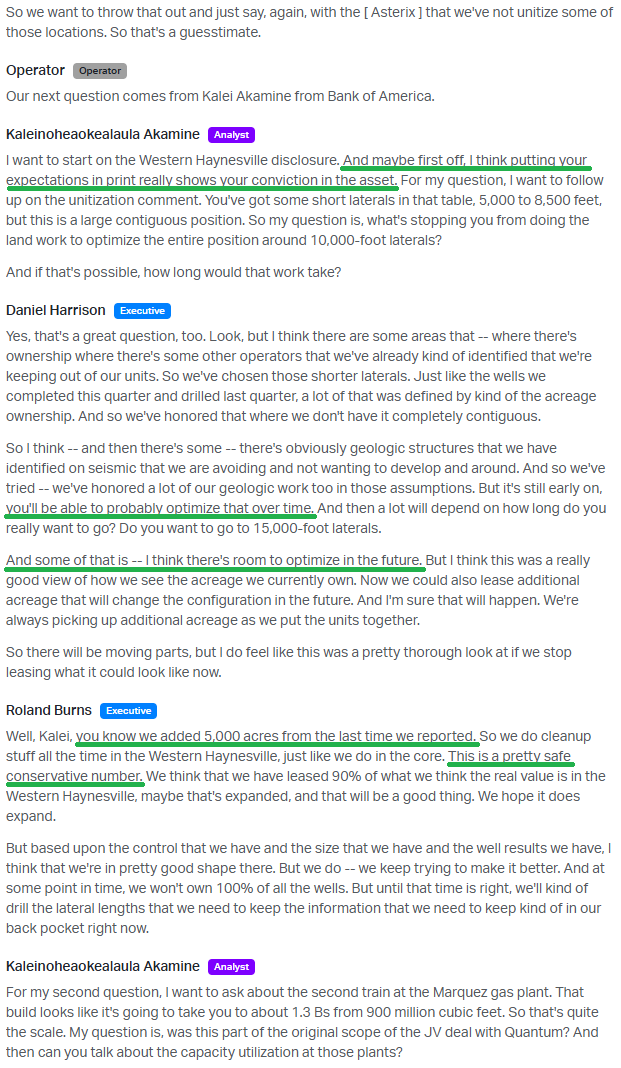
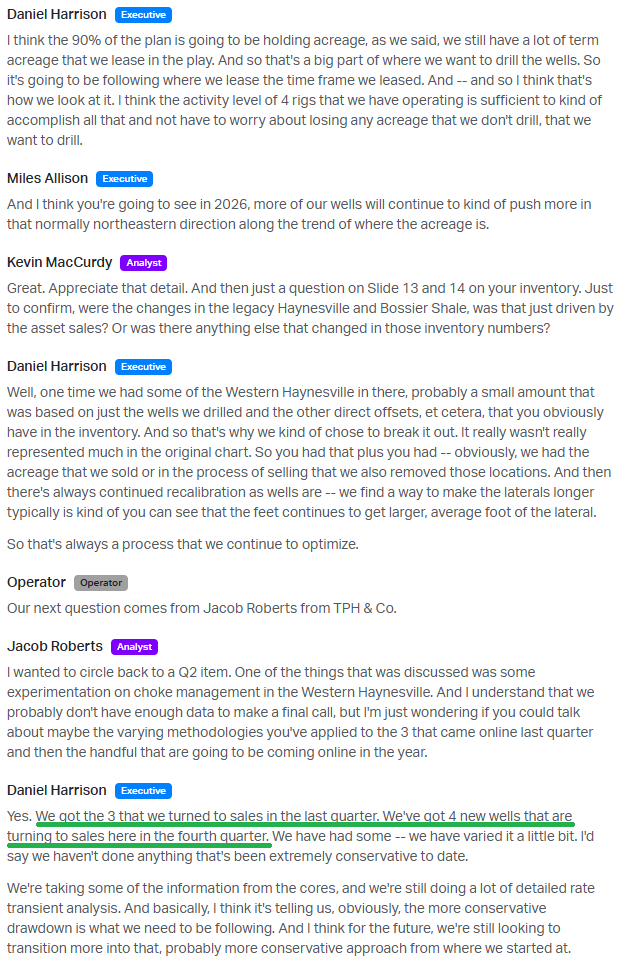
5) For the first time, management disclosed Western Haynesville inventory, estimating the 530k+ acres, up ~5k since the last report, to hold 2,559 net locations versus 917 net locations in the legacy Haynesville. Management continues to make progress on drilling efficiencies in the Western Haynesville, with drilling days to total depth improving to 52 from 55 last quarter and footage per day rising to 516 from 477. Management expects this region, which is projected to deliver significantly greater resource potential per section than legacy locations, to have 19 wells drilled and 13 wells turned to sales in 2025.
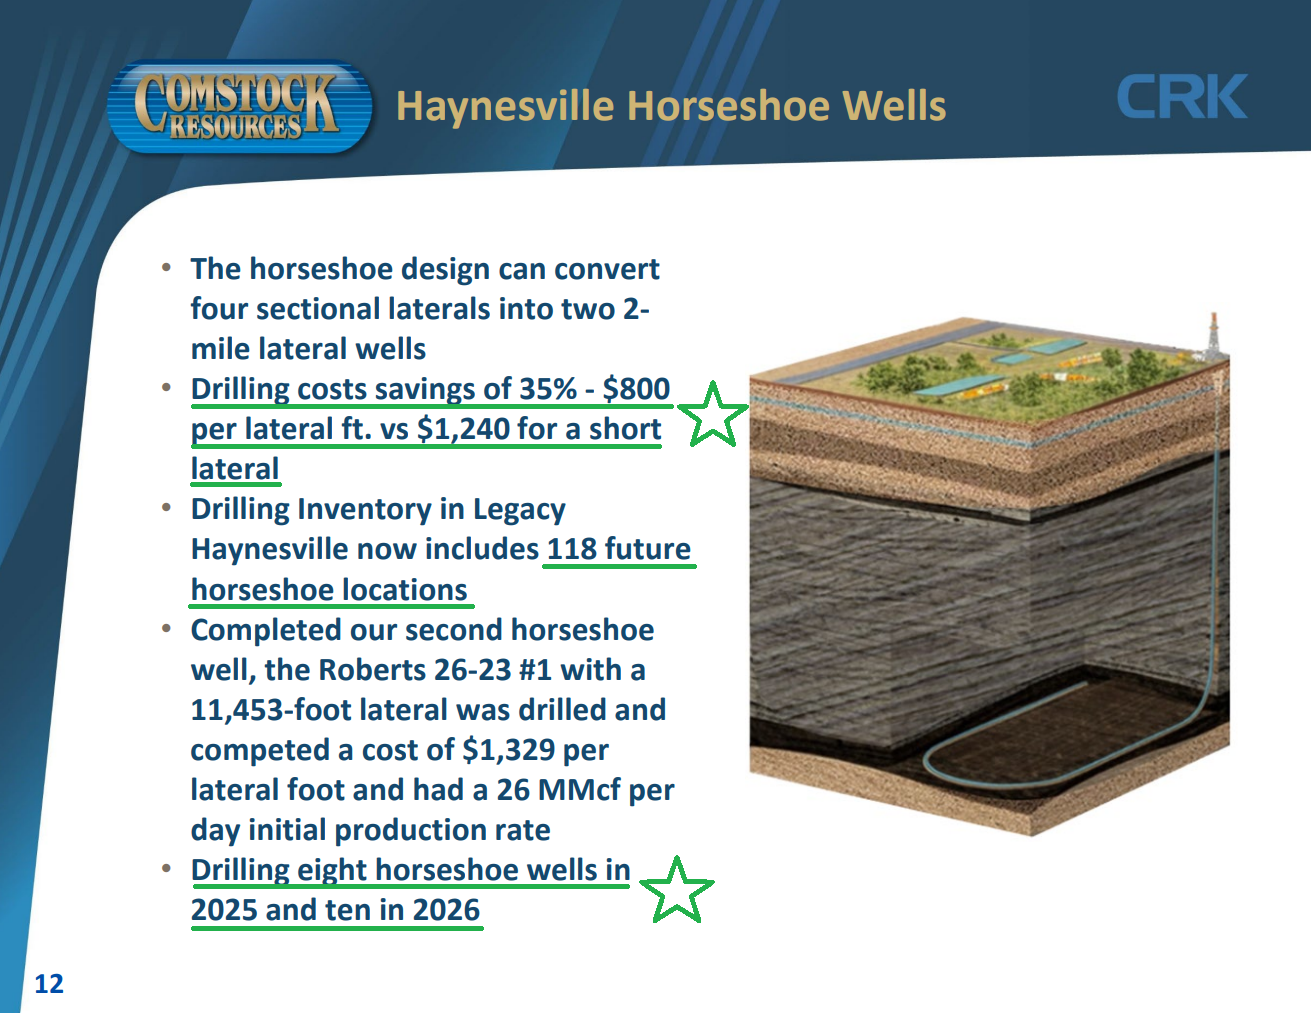
6) Comstock continues to implement new horseshoe design wells, driving drilling cost savings of 35%, with costs of $800 per lateral foot versus $1,240 for short laterals. Drilling inventory in the legacy Haynesville now includes 118 future horseshoe locations, with management expecting to drill 8 in 2025 and another 10 in 2026.
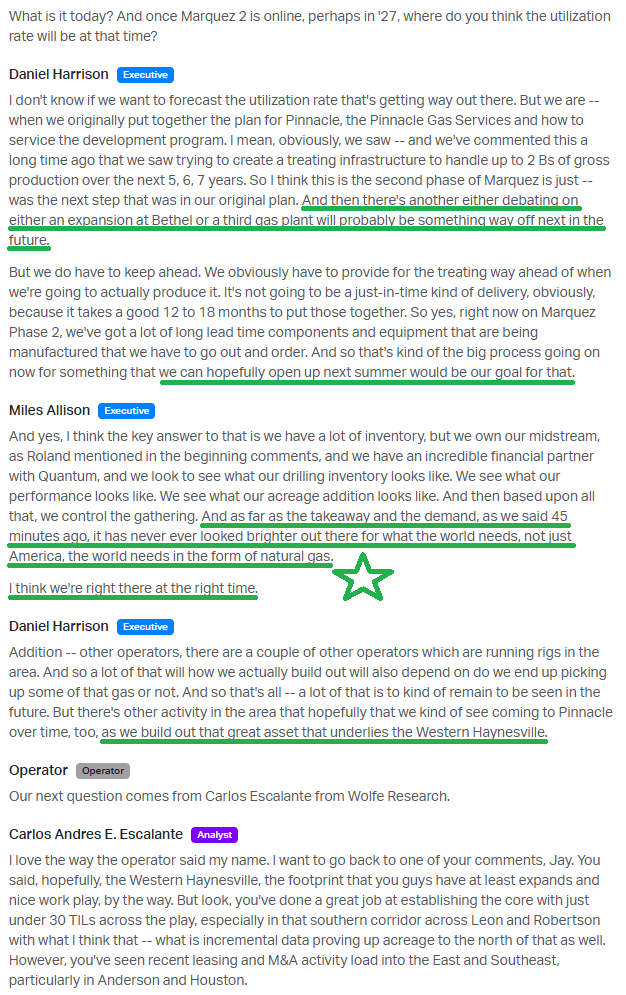
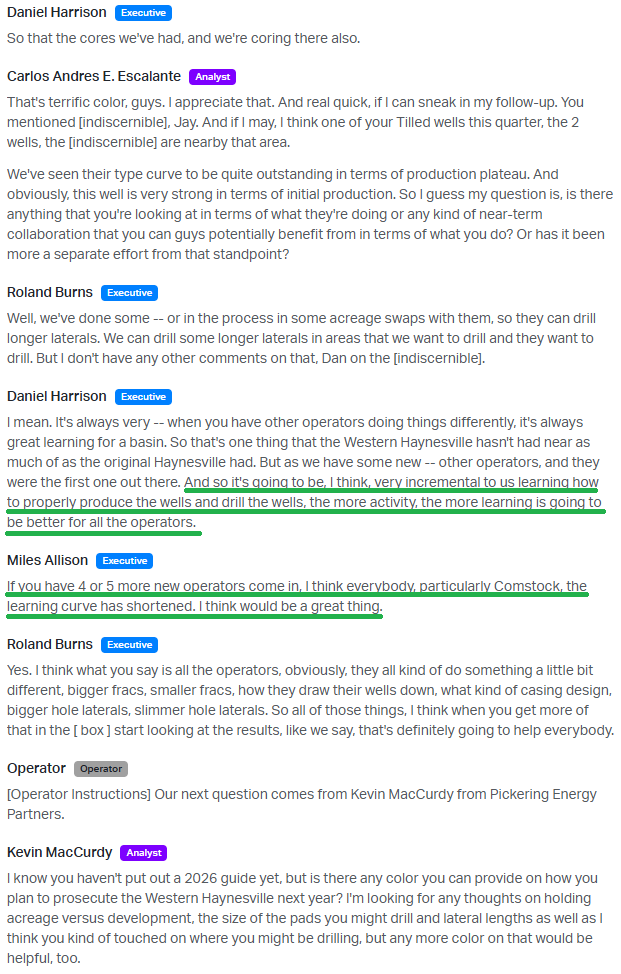
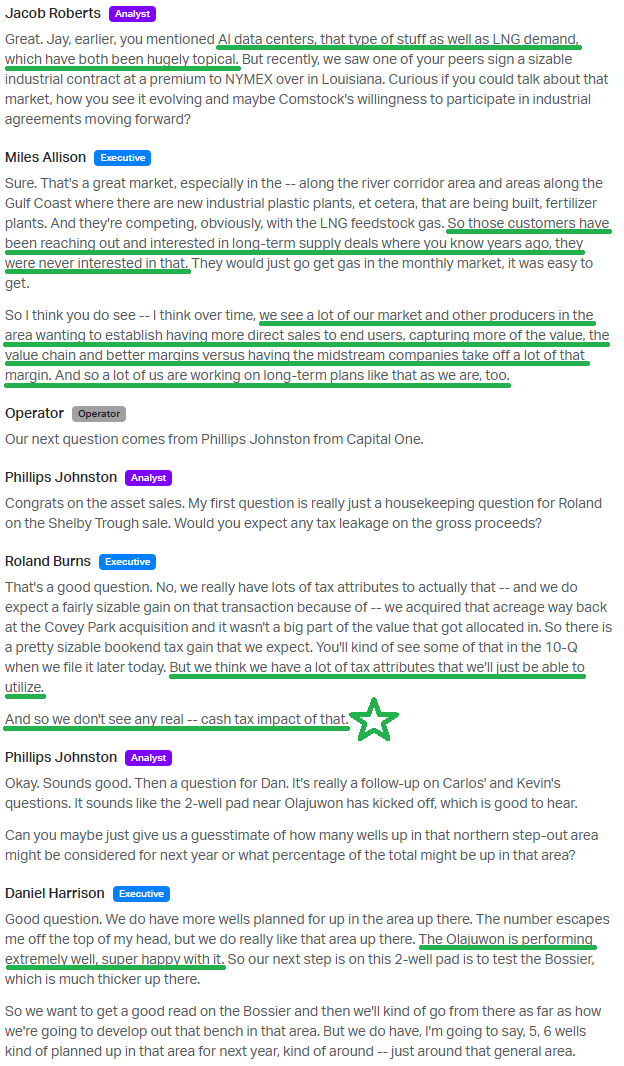
7) Management continues to see large end users driving new natural gas demand and seeking to establish direct relationships with producers, with customers reaching out about long-term supply agreements. Comstock believes it is well positioned, given its location, to support data center and AI demand as well as LNG export terminals, with management currently in discussions and working on long-term plans.
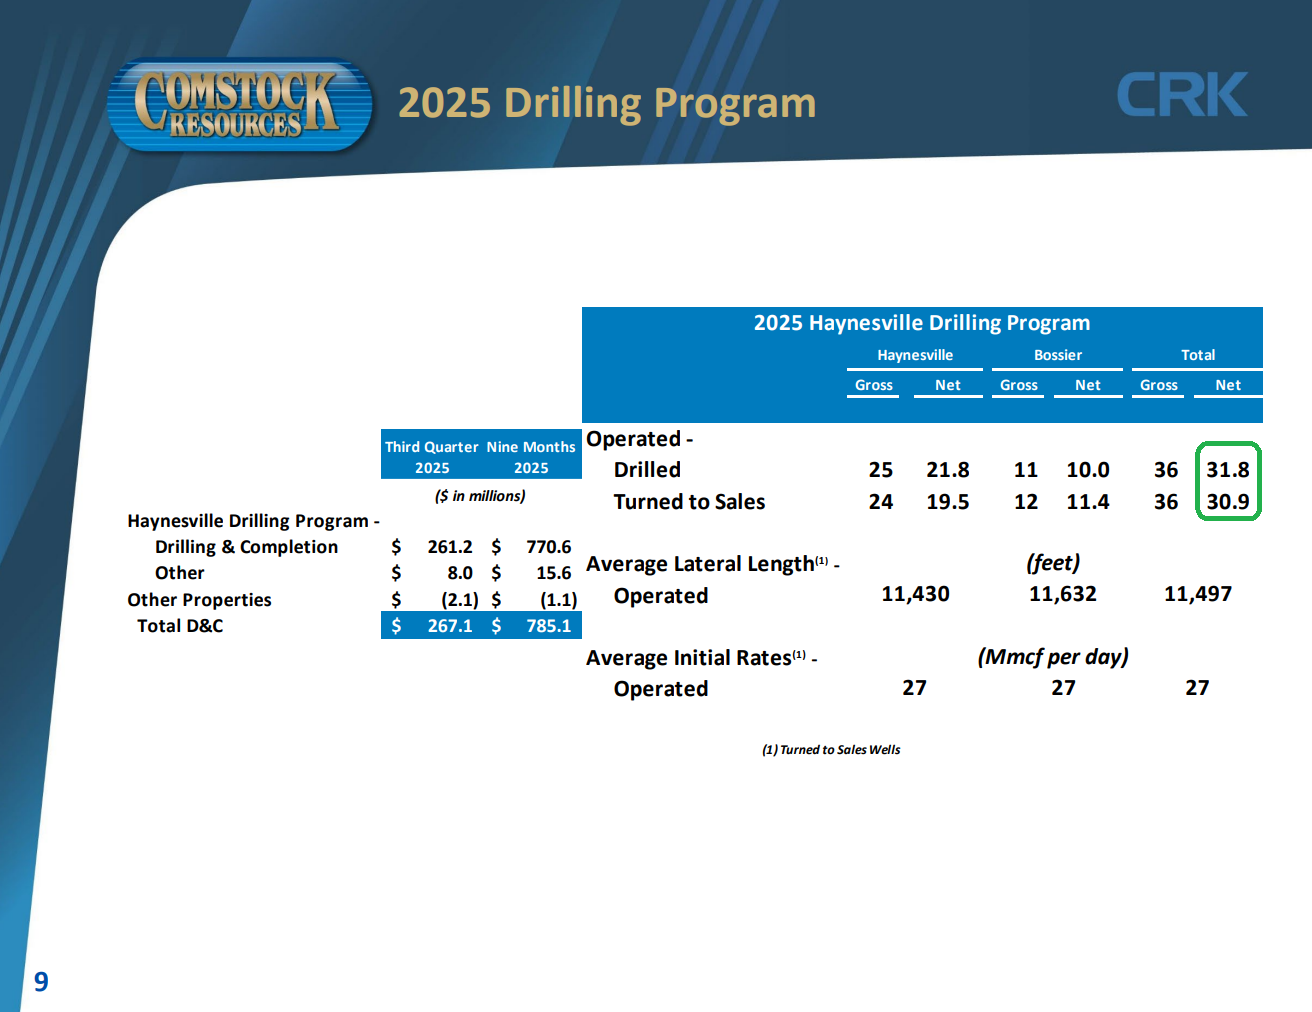
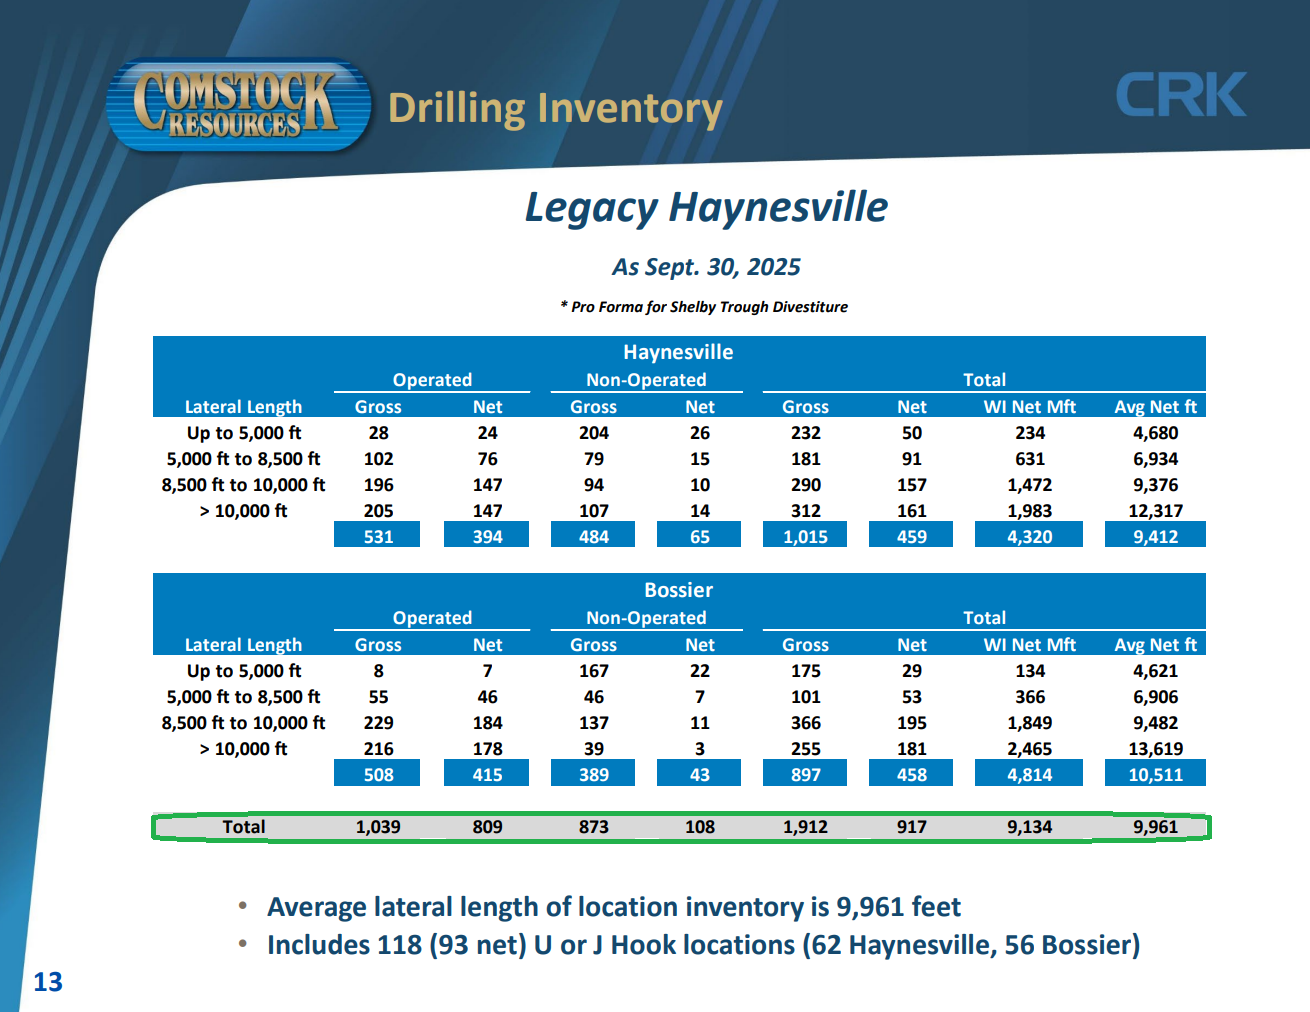
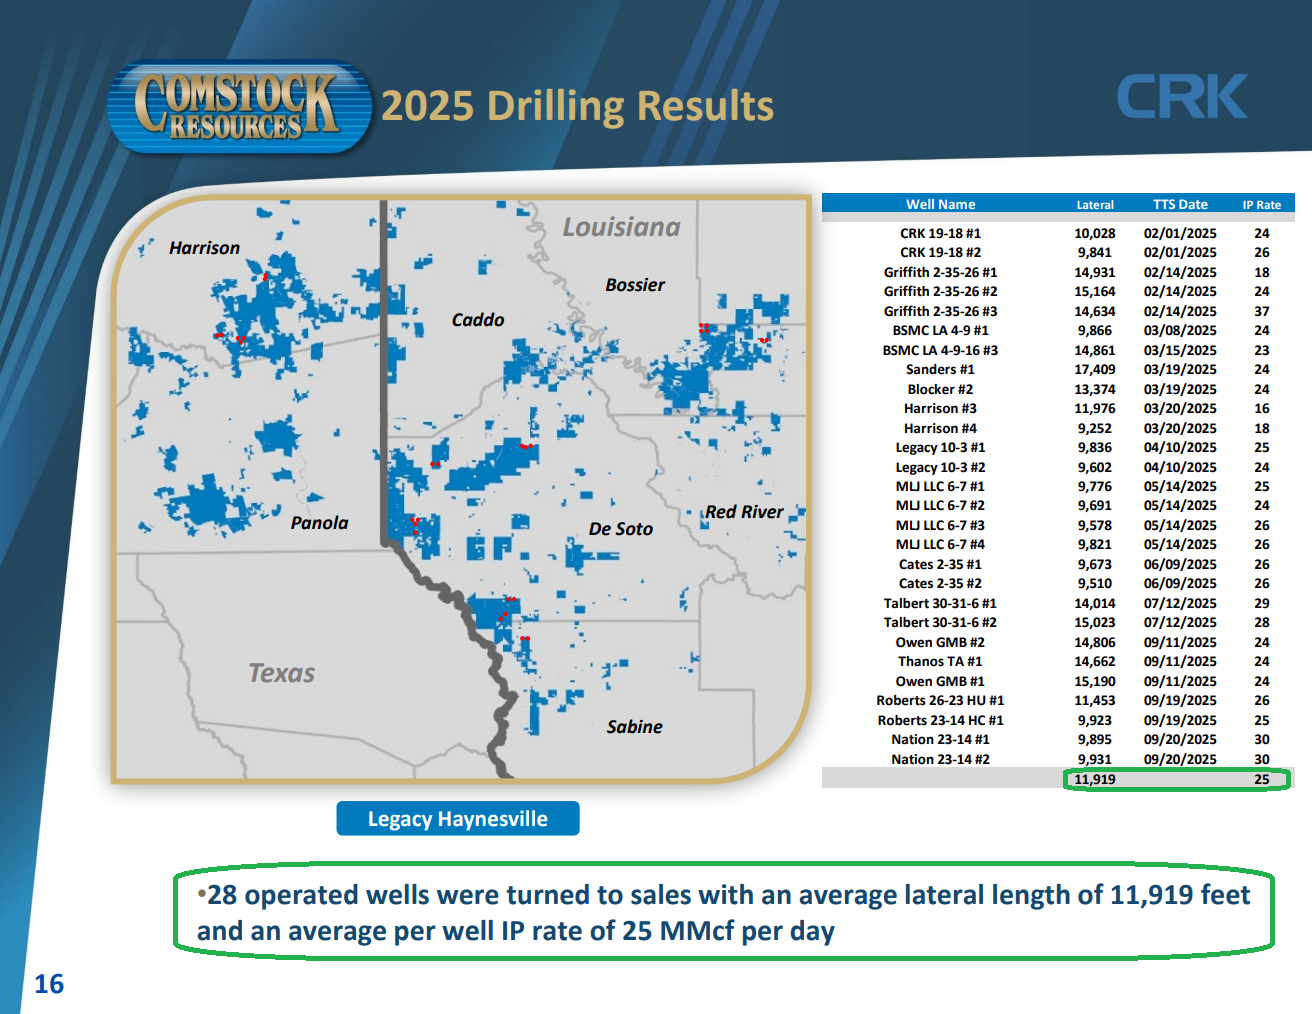
8) The legacy Haynesville region, spanning 266k+ net acres with 917 net locations, has seen 28 wells turned to sales year to date, with an average lateral length of 11,919 feet and average production of 25 MMcf per day. Management still expects to drill 33 wells and turn 35 wells to sales for the full year.
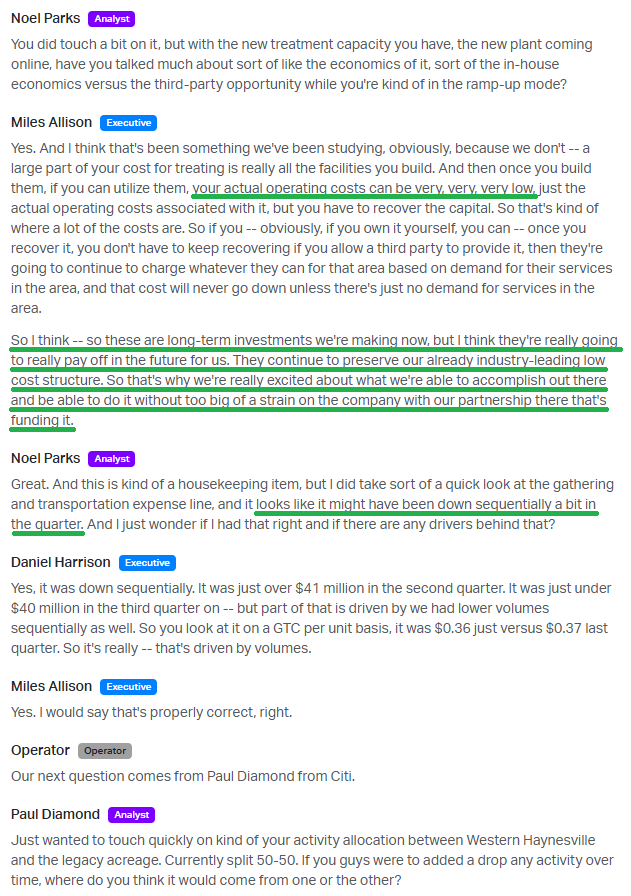
9) The new Marquez gas treating plant, which began operations in July and supports the Western Haynesville position, has more than doubled Comstock’s treating capacity by ~400 million cubic feet per day. Building out its own midstream is a major advantage for Comstock, helping keep operating costs low and preserve its already industry-leading low-cost structure.
10) Operating cash flow totaled $190M, or $0.65 per share, during the quarter, up over 25% from last year’s $152M. This brings year-to-date operating cash flow to $639M, up ~41% from last year’s $452M.
Earnings Call Highlights

National Oilwell Varco Update
National Oilwell Varco is the second name in our portfolio that gives us exposure to the left-for-dead energy sector.
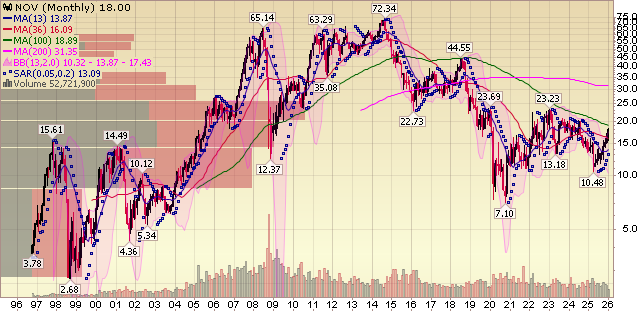
NOV is the largest OEM of rig systems and products for both onshore and offshore oil and gas drilling, commanding the largest installed base of rig equipment in the industry.
Part of what originally attracted us to NOV was gaining exposure to the energy upcycle without heavy direct exposure to underlying commodity price swings. That choice has paid off handsomely so far.
Even though the stock has already been an early winner for us with a solid move off our initial cost basis, we continue to view the story as having just barely left the station. Trading at just over 7x free cash flow, very little of the multi-year recovery and upside potential appears priced in.
While near-term commodity price pressure and noise around an OPEC+ supply glut have created some headwinds, there are two structural tailwinds that NOV is positioned to benefit from: the resurgence of offshore drilling and accelerating activity in international unconventional shale plays as North American shale rolls over.
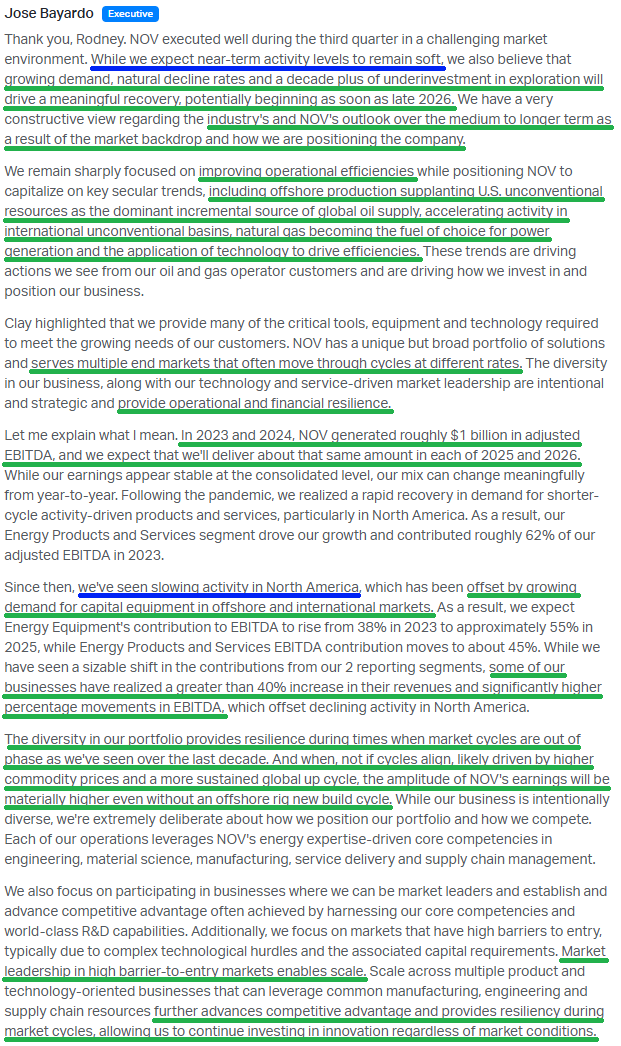
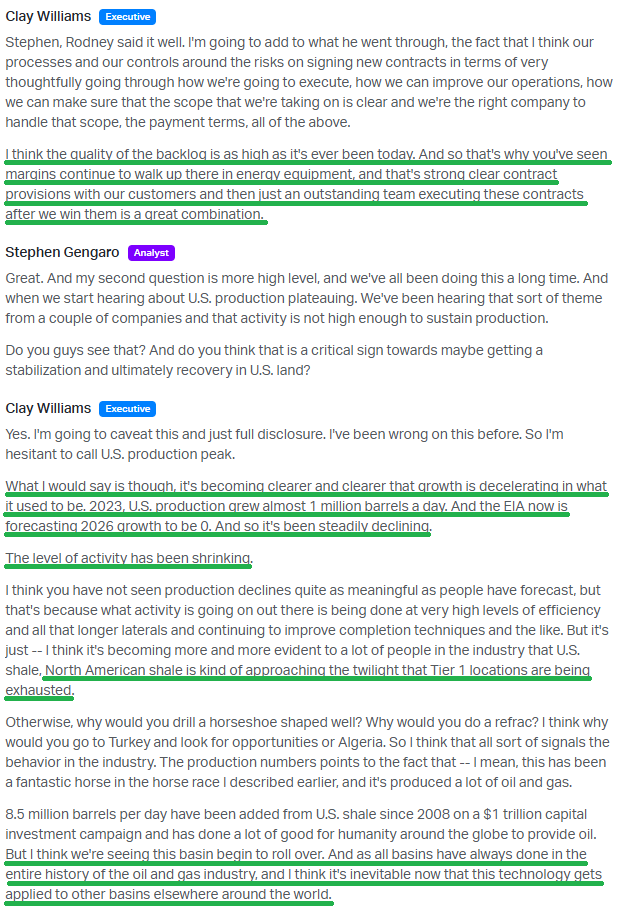
For the past decade, the oil production story has been dominated by North American shale, which has accounted for more than 80% of global supply growth. That dynamic has driven a decade-plus of underinvestment in exploration. Today, many of those shale basins are plateauing and returns are becoming less economical, setting the stage for a long-awaited rotation back to offshore and international development.
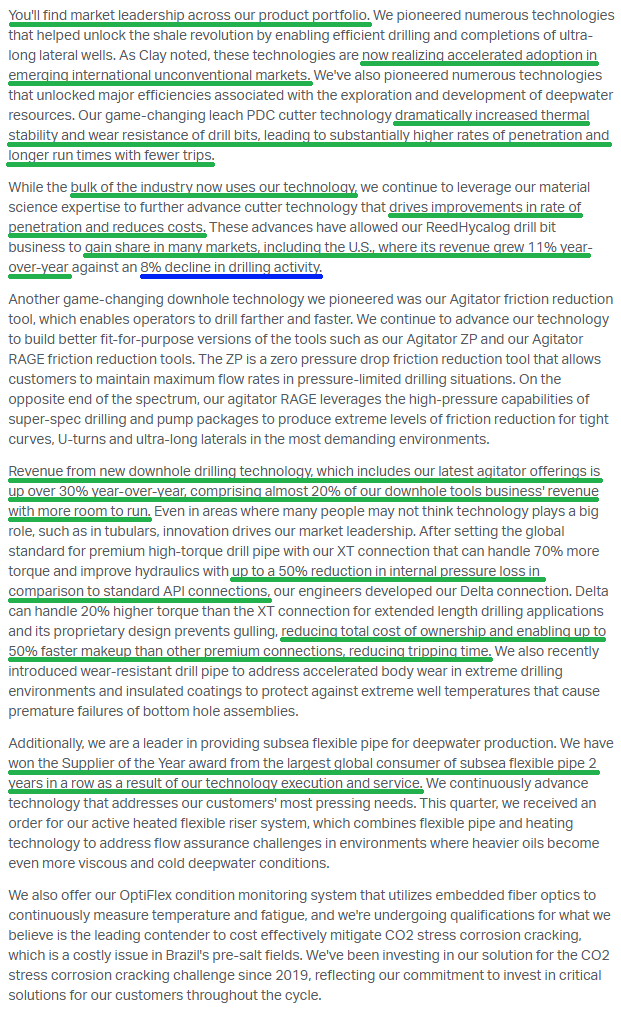
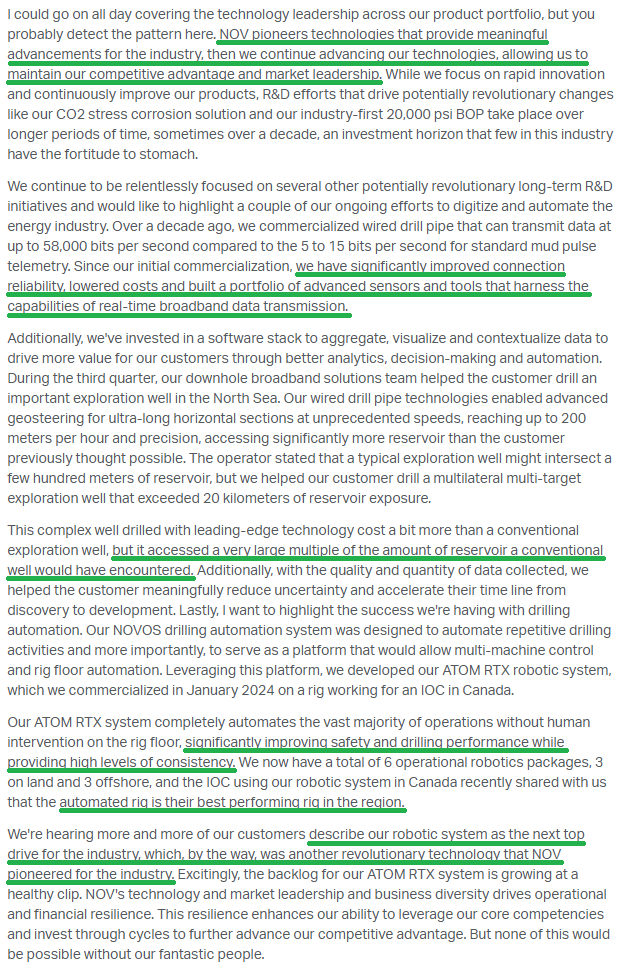
This rotation demands precisely the market-leading products NOV provides: tubing, pumps, downhole tools, rig equipment, and more. That is why we see NOV as one of the best pick-and-shovel beneficiaries of the next leg of the energy cycle.
NOV has positioned itself well for when, not if, the cycle turns. Management has taken nearly $100M of structural costs out of the business while sitting on a massive and growing capital equipment backlog of $4.56B. Free cash flow recovery is already underway, with just under $1B generated last year, a minimum of 50% of which is returned to shareholders via repurchases and dividends. All of this is backed by a strong balance sheet, with $1.21B in cash against $1.73B of total debt and no maturities until 2029.
The whipped cream and cherry on top is the U.S.-led push to revive Venezuela’s oil production.
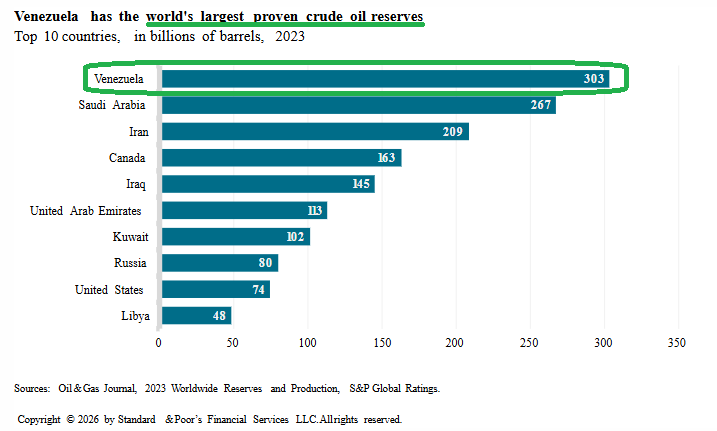
Venezuela holds the world’s largest proven reserves at roughly 303B barrels, yet its infrastructure has endured more than two decades of mismanagement and chronic underinvestment. If the administration is serious about lifting output toward historical levels of ~3M barrels per day from under 1M today, the early years will focus far more on large-scale renovation than on new-field production. Industry estimates point to at least $100B required to rebuild the country’s oil infrastructure.
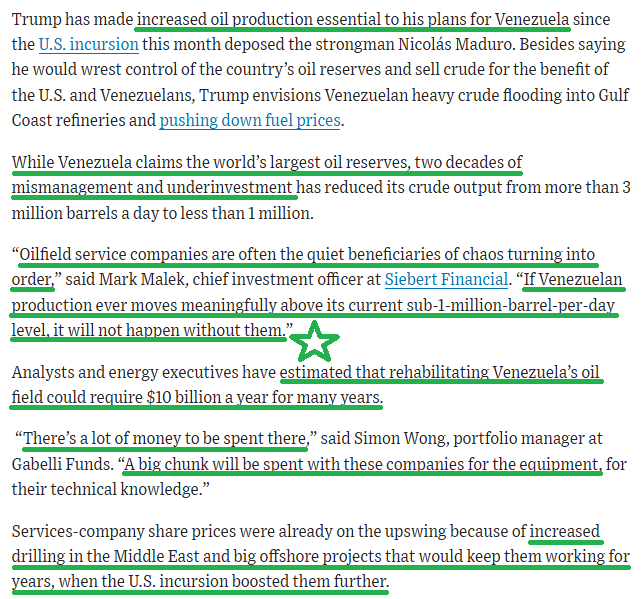
Source: WSJ
If that plays out, NOV’s pipes, tubing, and market-leading rig technologies would be in hot demand, making it a major beneficiary alongside the other leading servicers.
Whether Venezuela ultimately delivers or not is anyone’s guess. But we’re more than happy to take the free flier on it…
Q3 Earnings Breakdown
10 Key Points
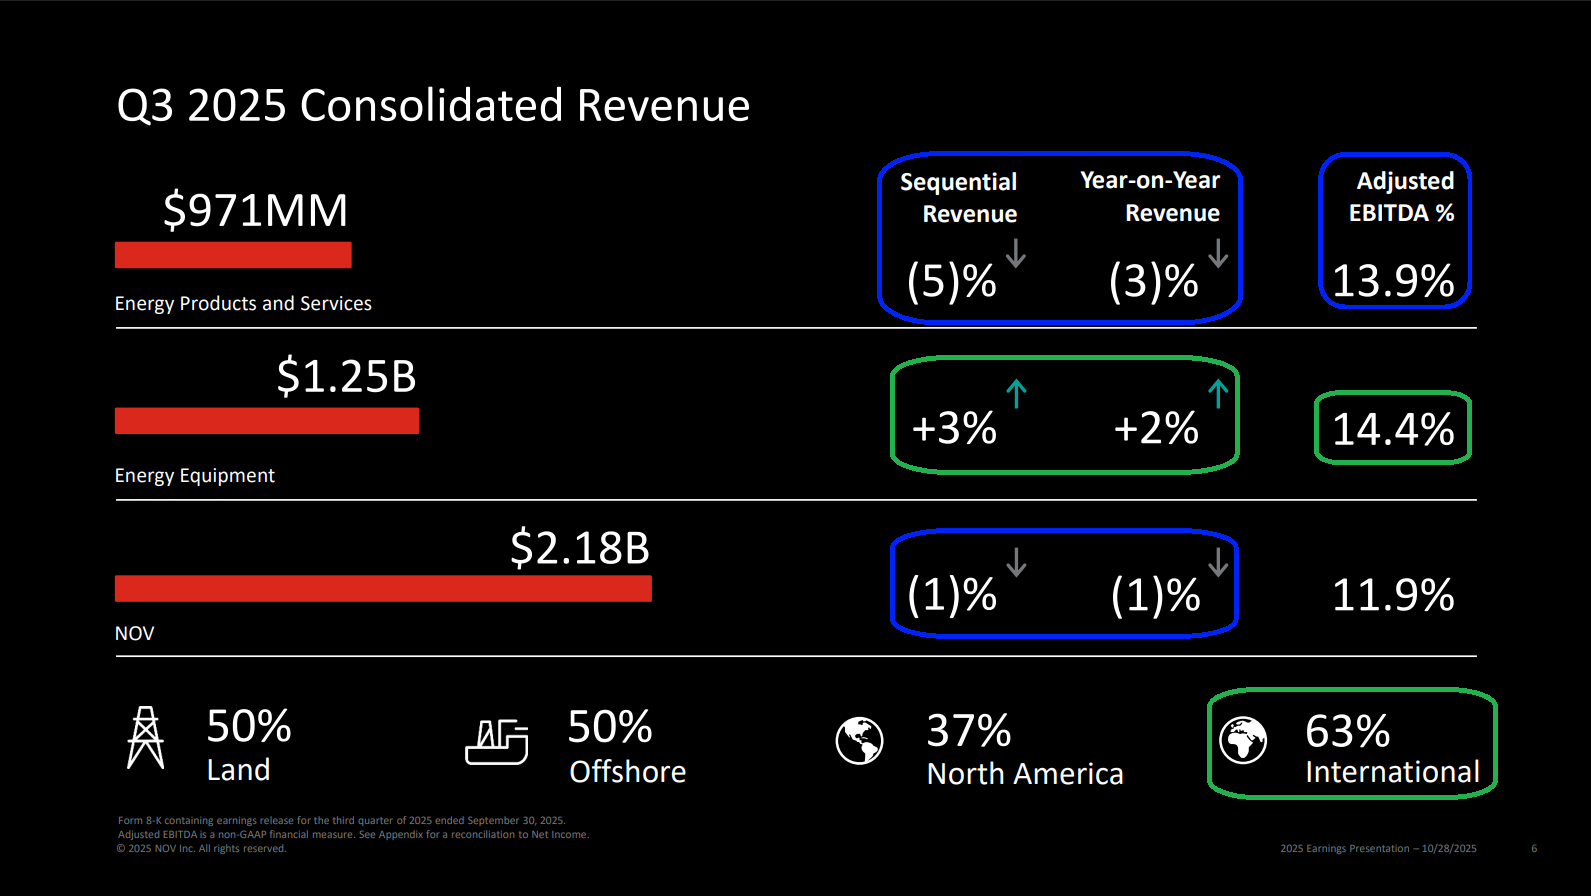
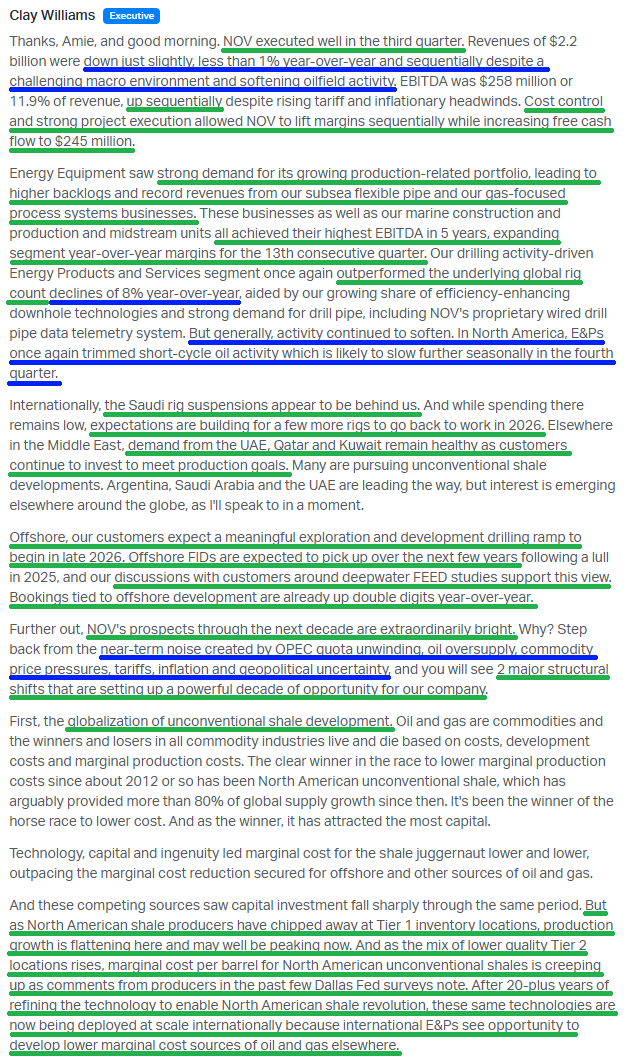
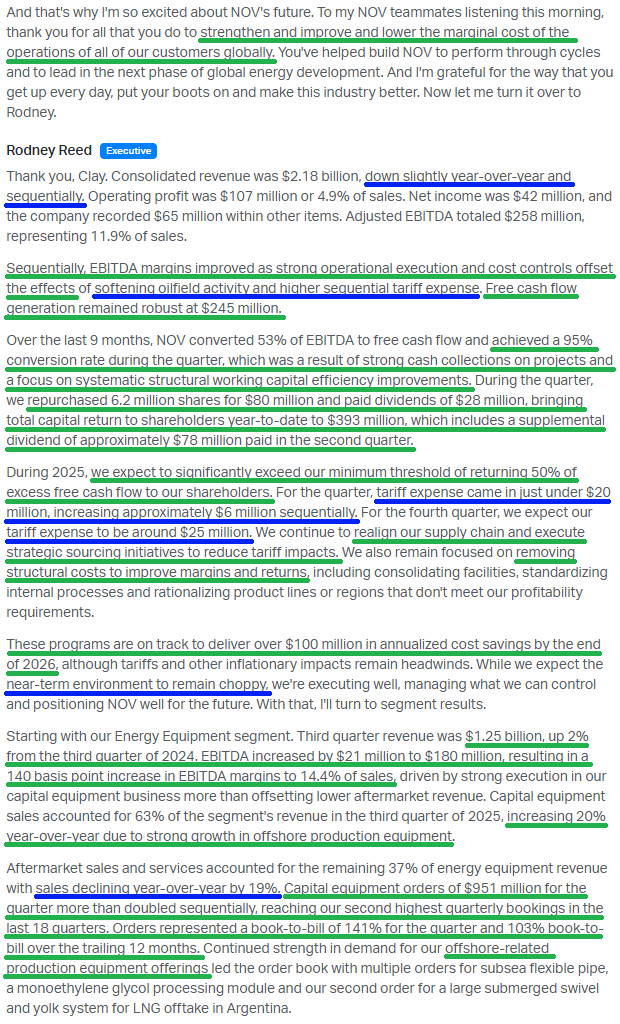
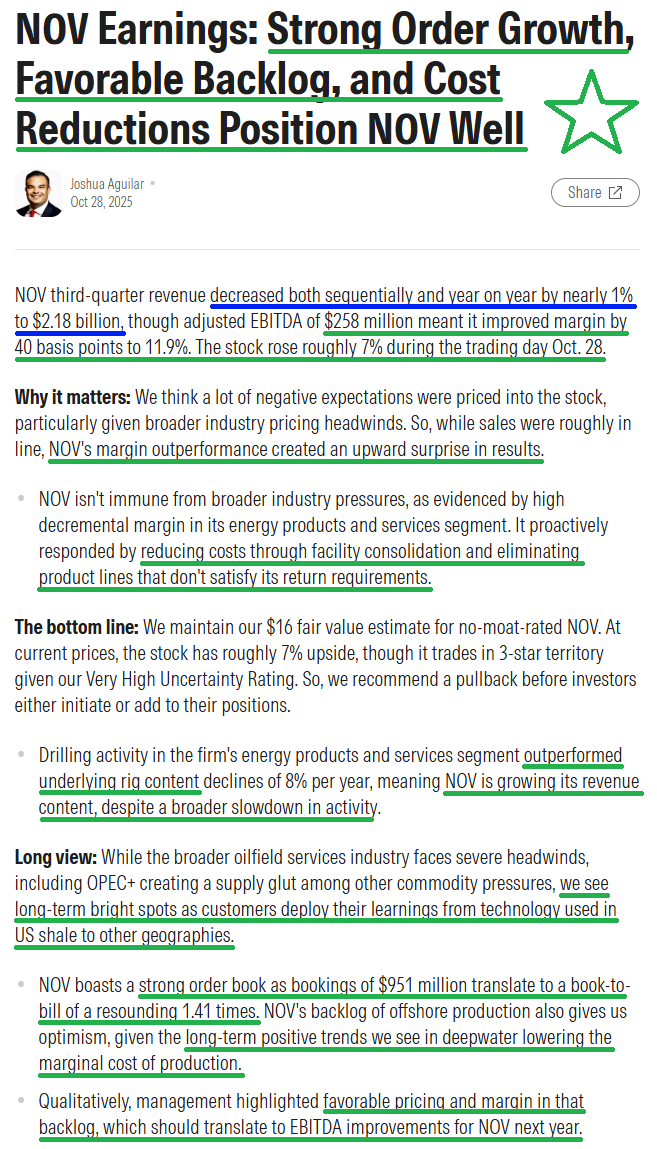
1) NOV reported Q3 revenue of $2.18B, down 1% both YoY and sequentially, and beating estimates by ~$39M. Adjusted EBITDA declined 10% YoY to $258M, with margins of 11.9%, while adjusted EPS came in at $0.21 versus consensus estimates of $0.24.
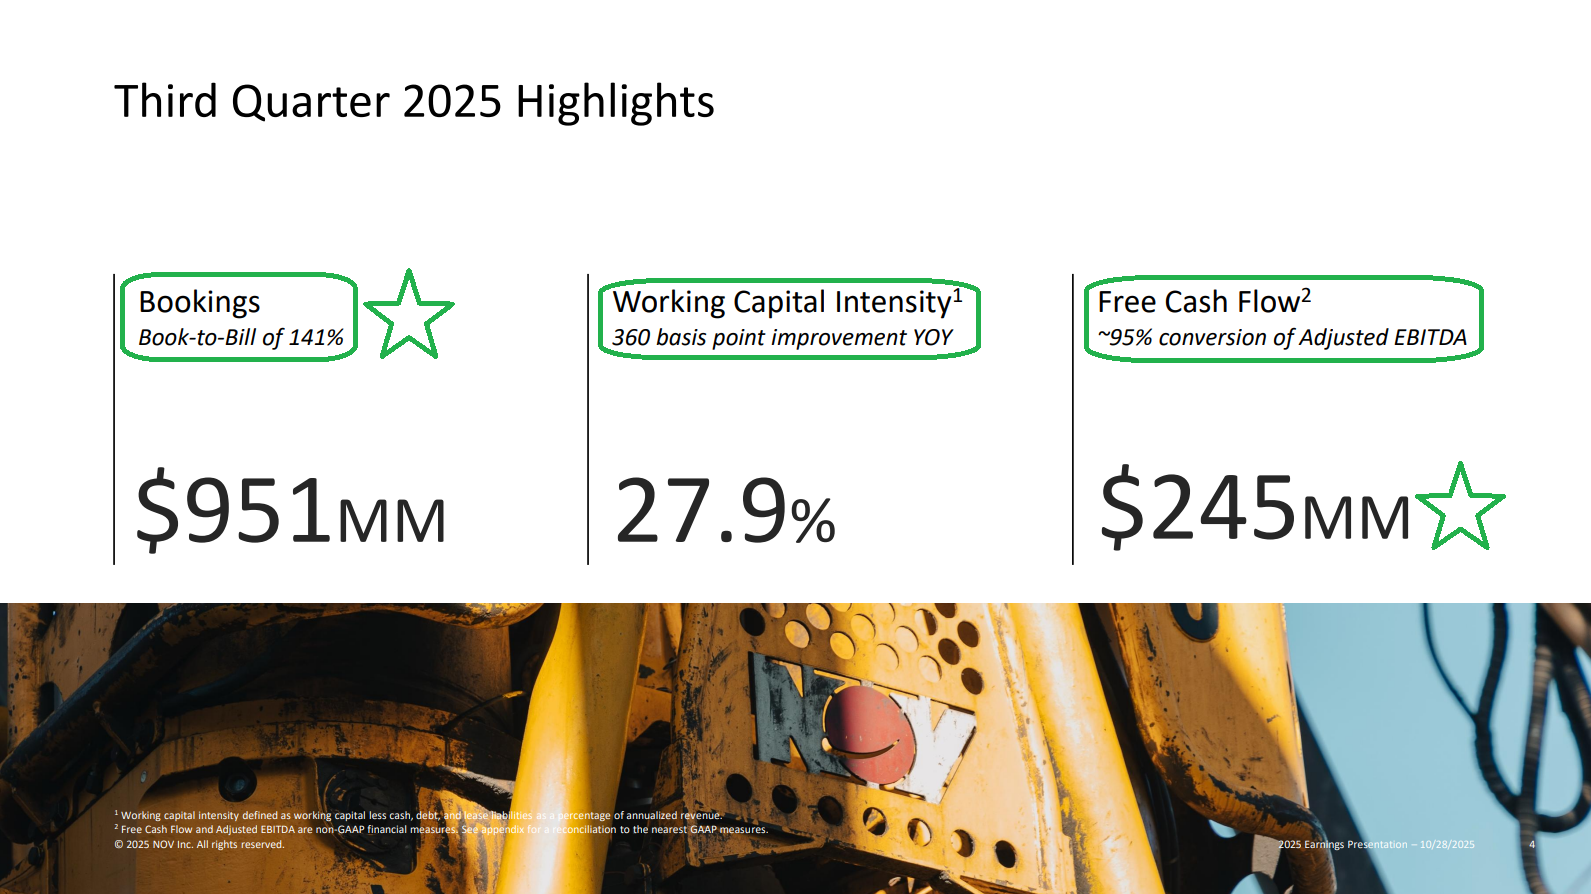
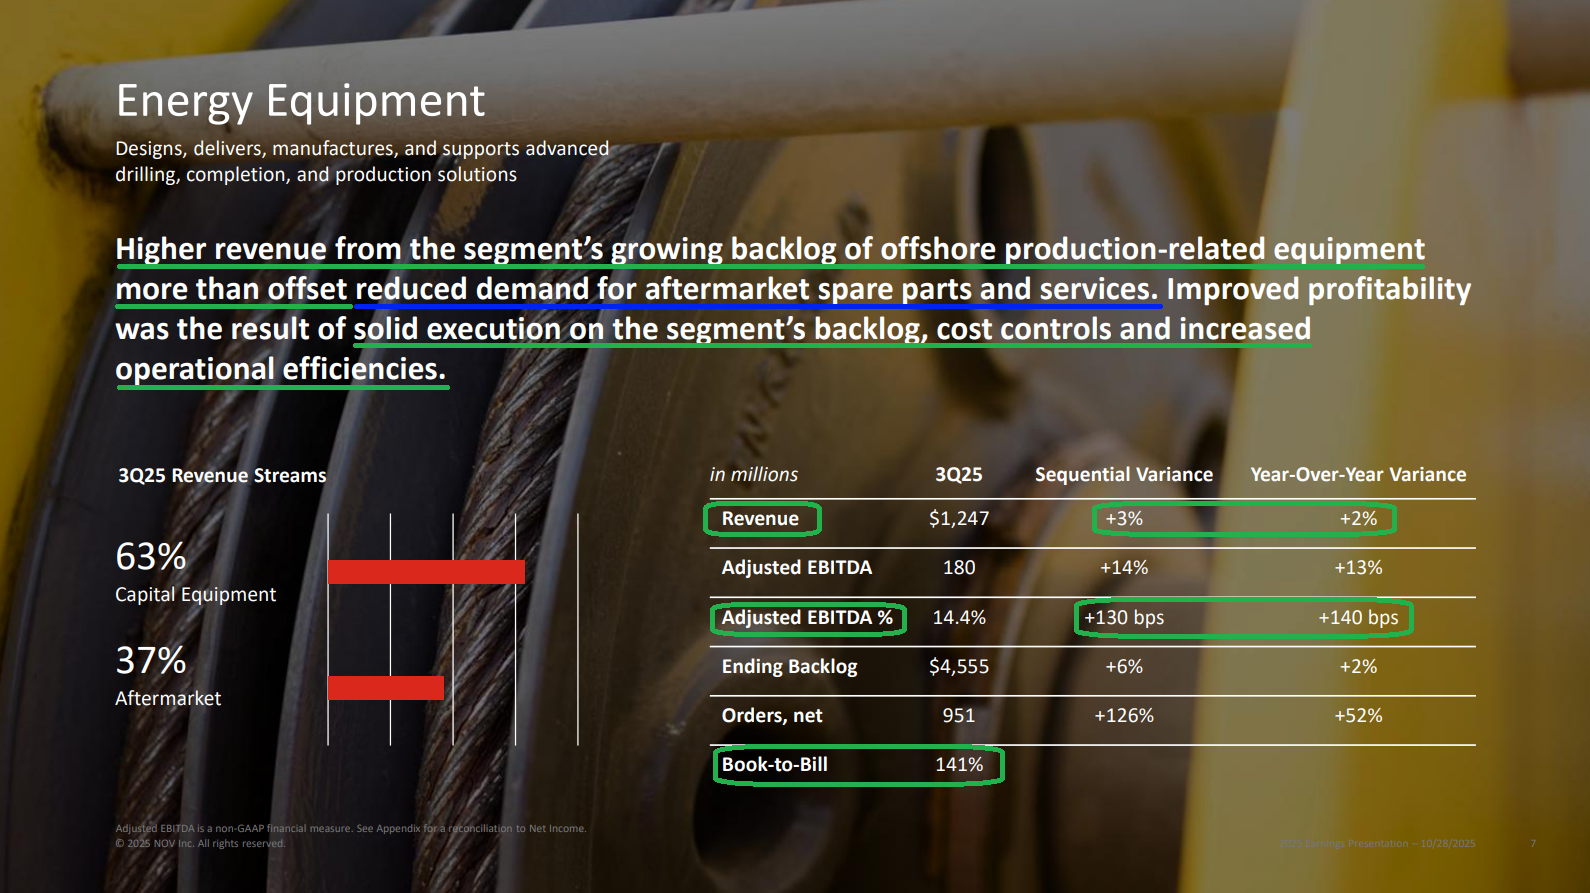
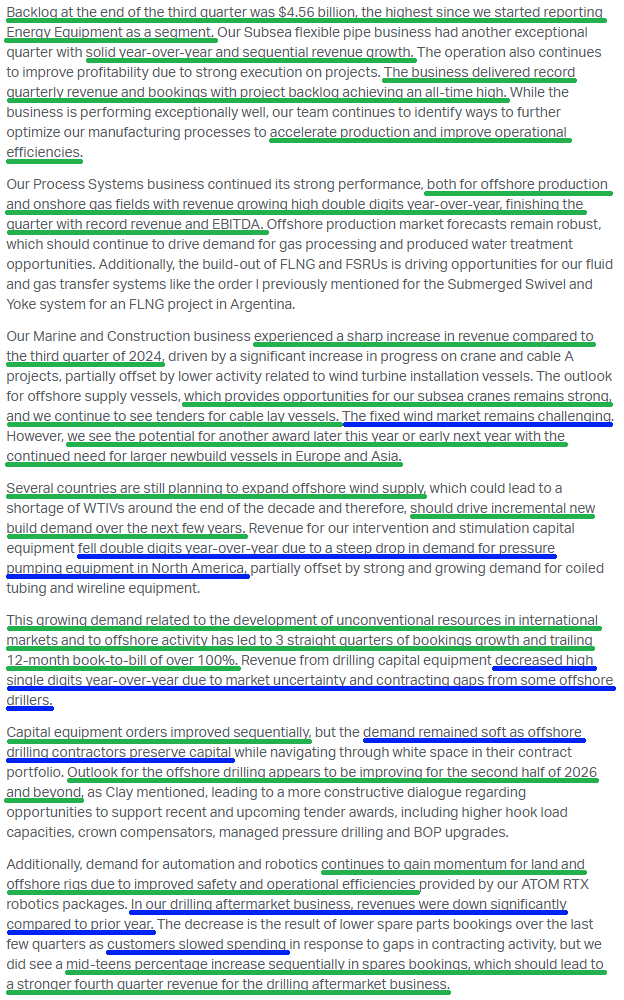
2) The Energy Equipment segment posted $1.25B in revenue, up 3% YoY and 2% sequentially, with adjusted EBITDA margins expanding 140 bps YoY to 14.4%, marking the segment’s 13th straight quarter of YoY margin improvement. Bookings totaled $951M during the quarter, the second-highest level in the last 18 quarters, delivering a book-to-bill ratio of 141%. Backlog for capital equipment orders now stands at $4.56B, up $77M YoY, with management calling the overall quality of the backlog as high as it has ever been and margin accretive.
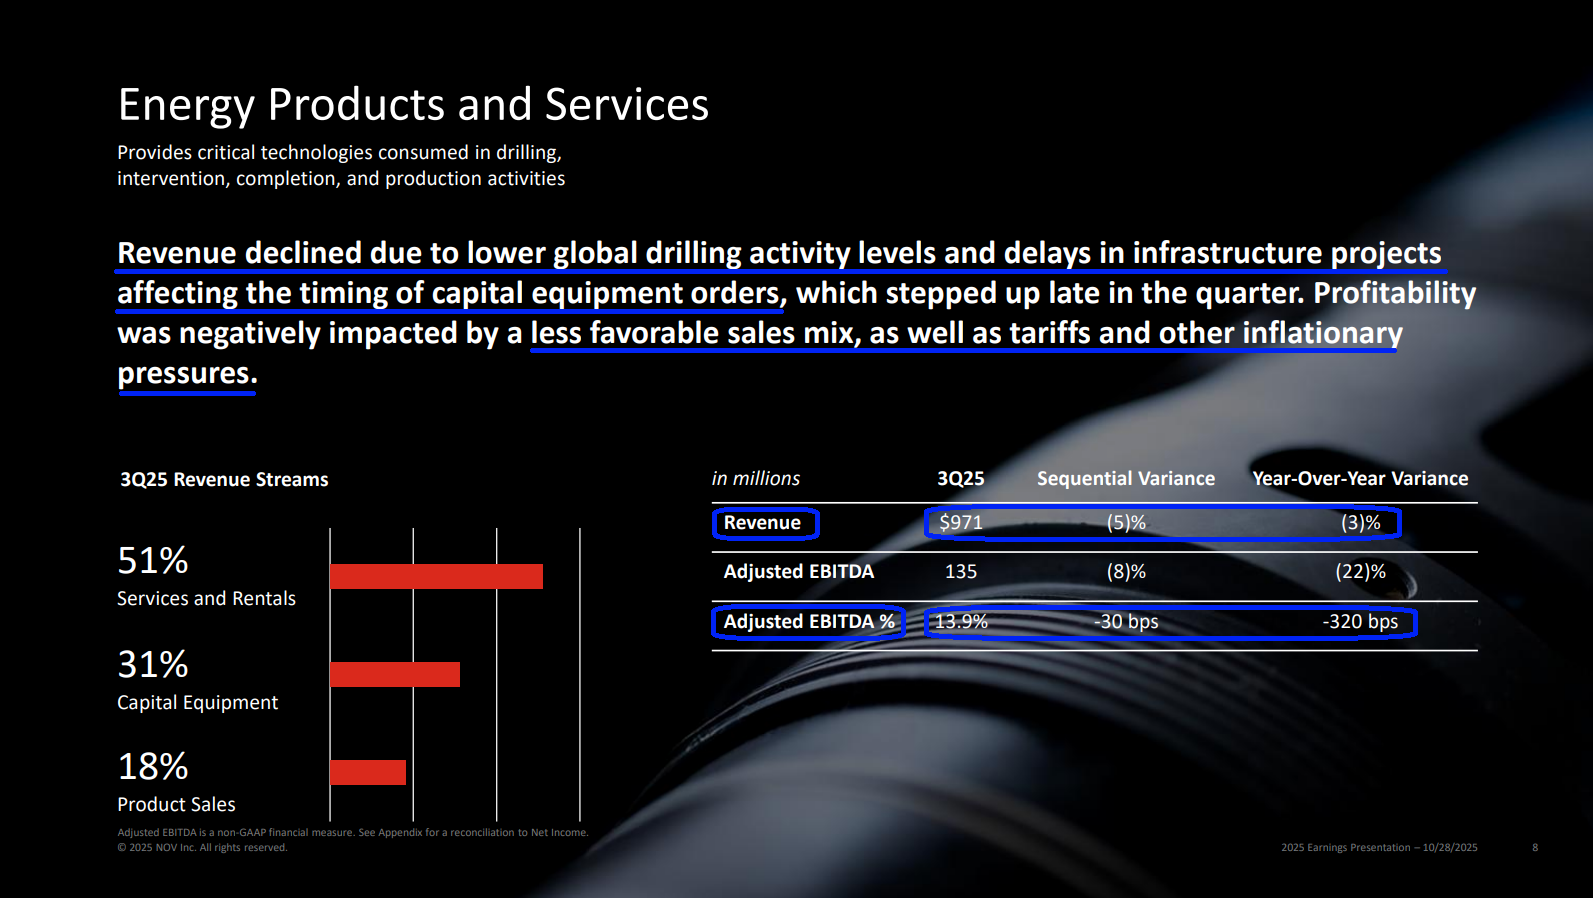
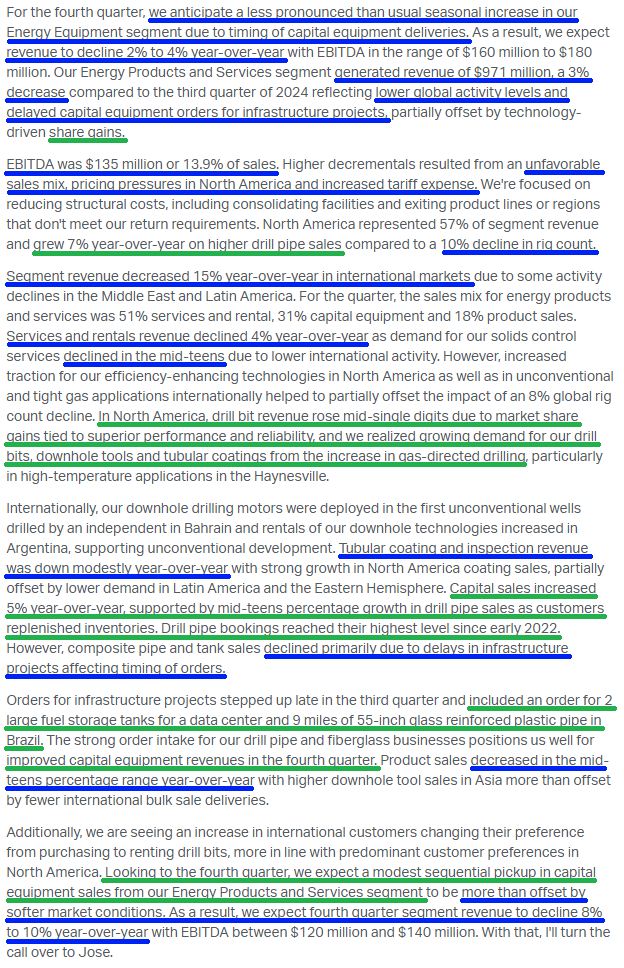
3) The Energy Products and Services segment generated $971M in revenue, down 3% YoY and 5% sequentially, as lower global drilling activity and delays in infrastructure projects continued to weigh on results. Adjusted EBITDA margins came in at 13.9%, down 320 bps YoY, with management expecting softer market conditions to persist in the near term.
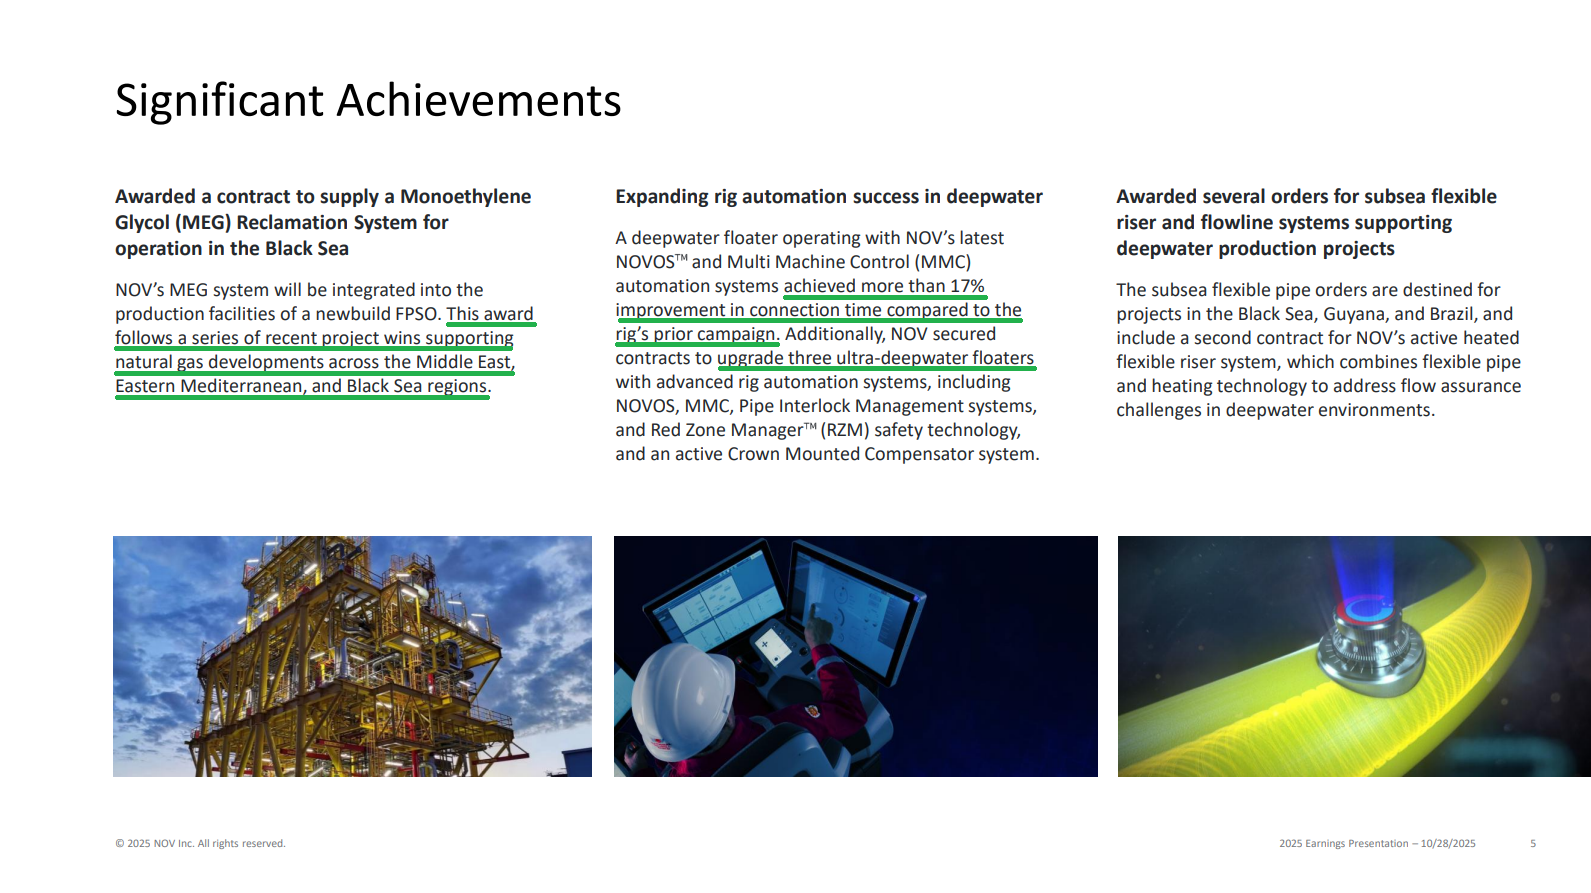
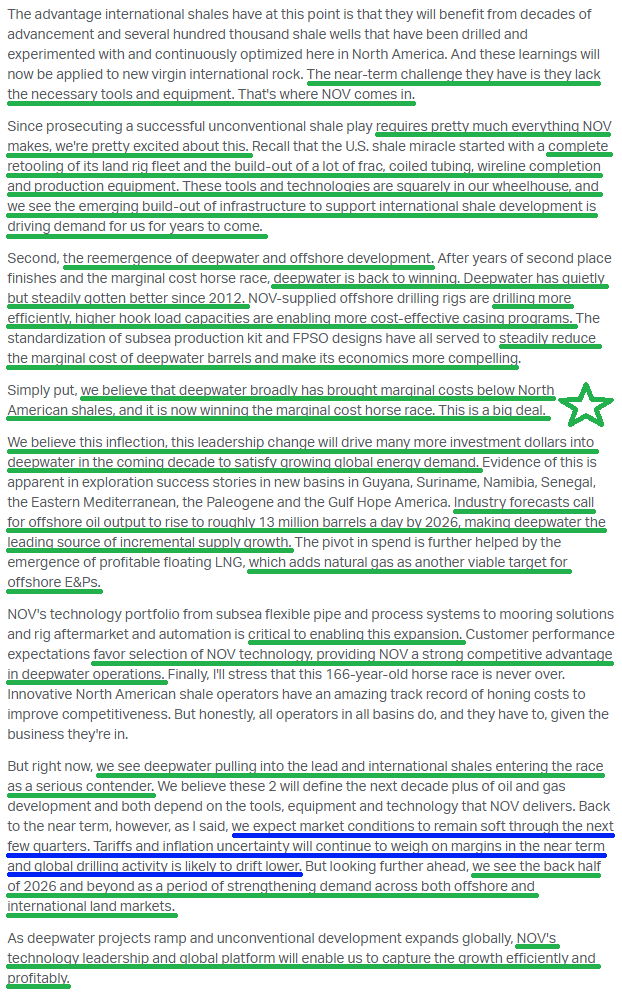
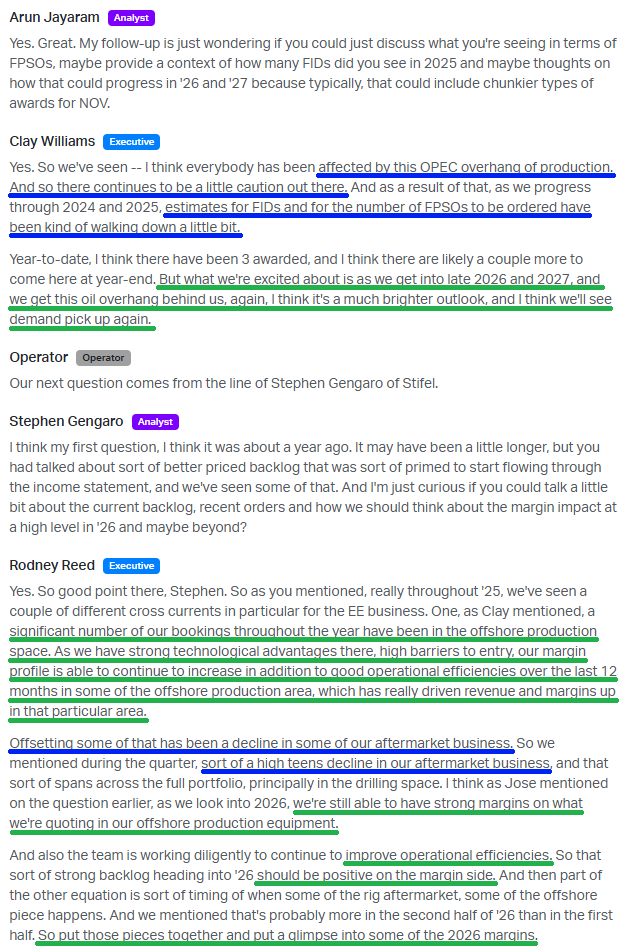
4) Management is highly encouraged by what they are seeing in offshore, with a “resurgence” in investment driving offshore development bookings up double digits YoY. Management expects the offshore upcycle to continue gaining momentum, with development drilling set to ramp in late 2026 and offshore FIDs picking up over the next few years. Deepwater has now broadly brought marginal costs below North American shale, positioning offshore oil as the leading source of incremental growth starting in 2026.
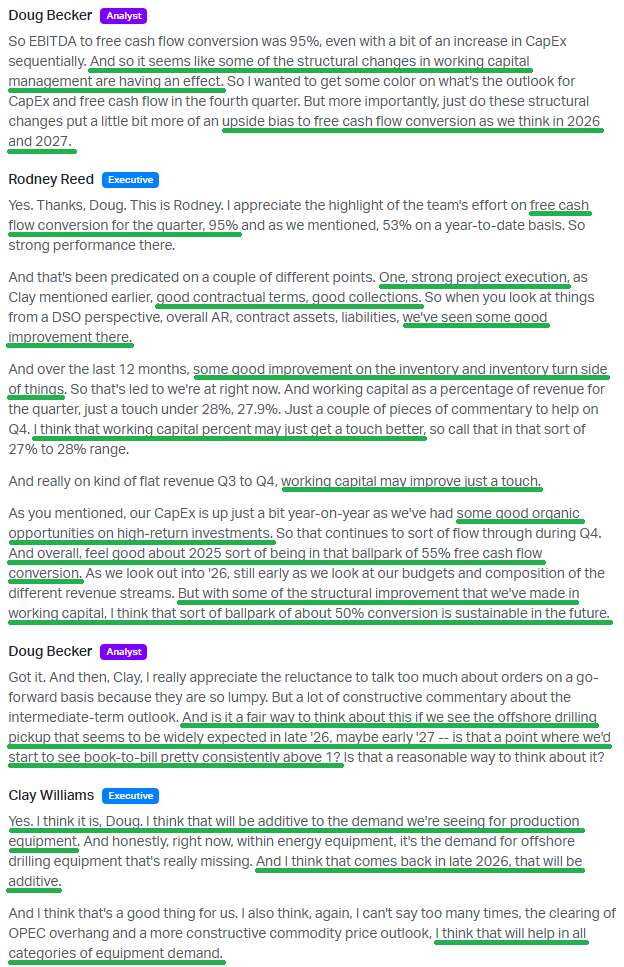
5) NOV continues to generate strong free cash flow, delivering $245M in FCF during Q3 and bringing YTD FCF to $404M. This marked a 95% conversion of adjusted EBITDA in the quarter, with YTD conversion now at 53%. Working capital intensity improved to 27.9%, a 360 bps improvement, with management expecting these structural working capital improvements to support a sustainable 50%+ FCF conversion going forward.
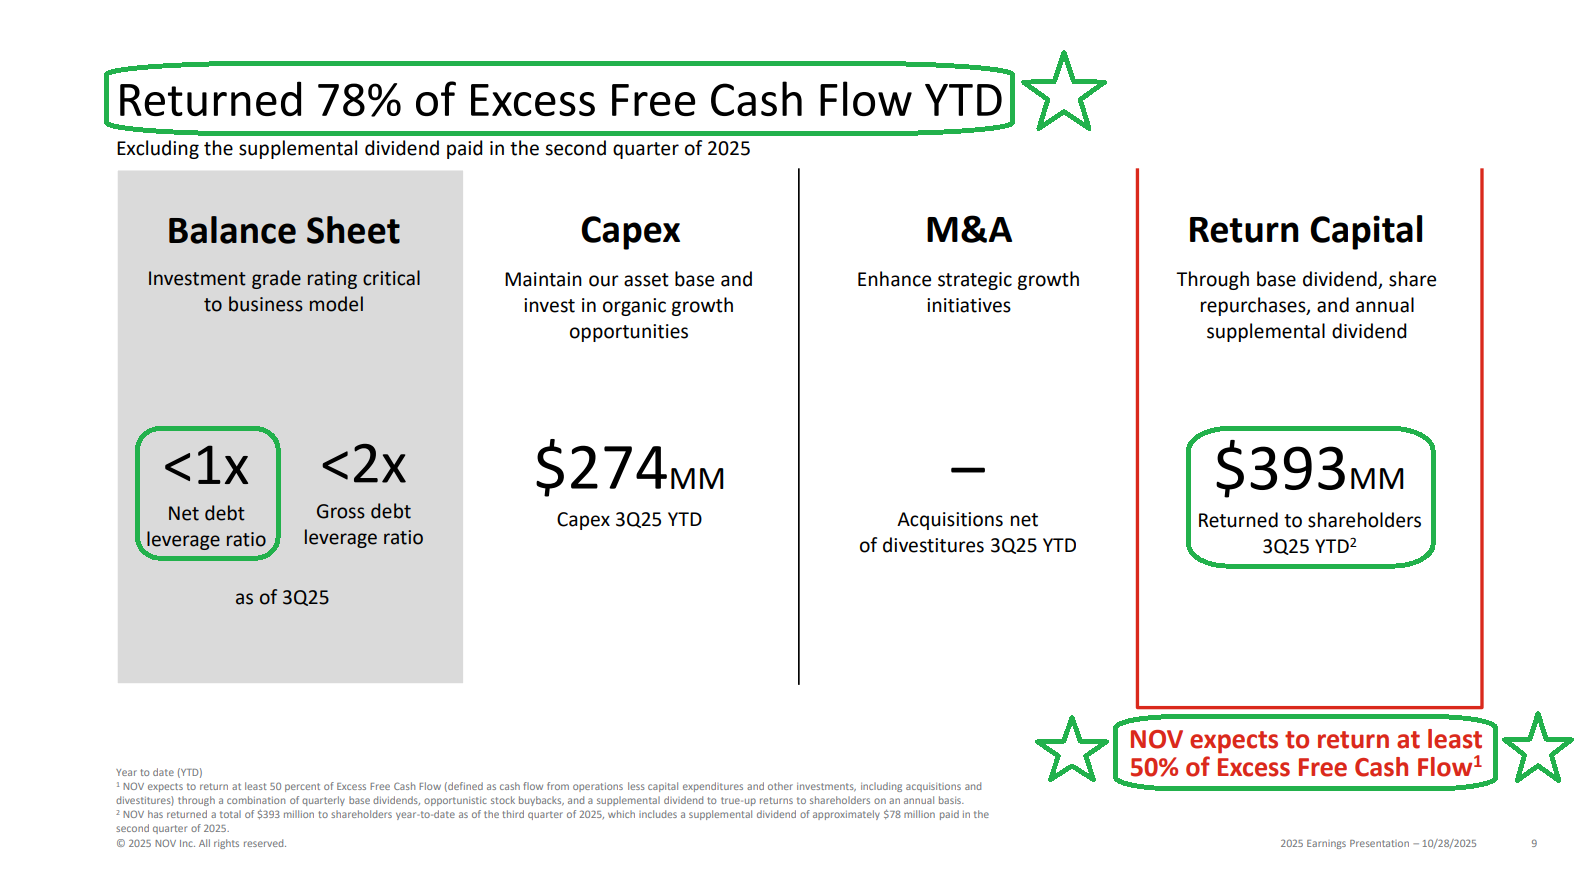
6) Management returned $108M of capital to shareholders during the quarter, repurchasing 6.2M shares for $80M and paying out $28M in dividends. Year to date, management has returned $393M, representing 78% of excess FCF, well above the stated 50% minimum target.
7) Management continues to focus on removing structural costs and driving operational efficiencies to improve margins and returns, with cumulative cost savings programs on track to deliver over $100M in annualized savings by the end of 2026.
8) NOV continues to maintain a rock-solid balance sheet, holding $1.21B in cash and cash equivalents against total debt of $1.73B, with $1.5B available on its primary revolving credit facility. Net leverage now stands below 1x, with gross leverage below 2x, leaving plenty of dry powder to lean into share repurchases.
9) Tariff expenses during Q3 came in just under $20M, up $6M sequentially. Management expects Q4 tariff expense to be ~$25M as they continue to realign the supply chain and execute strategic sourcing initiatives to reduce tariff impacts.
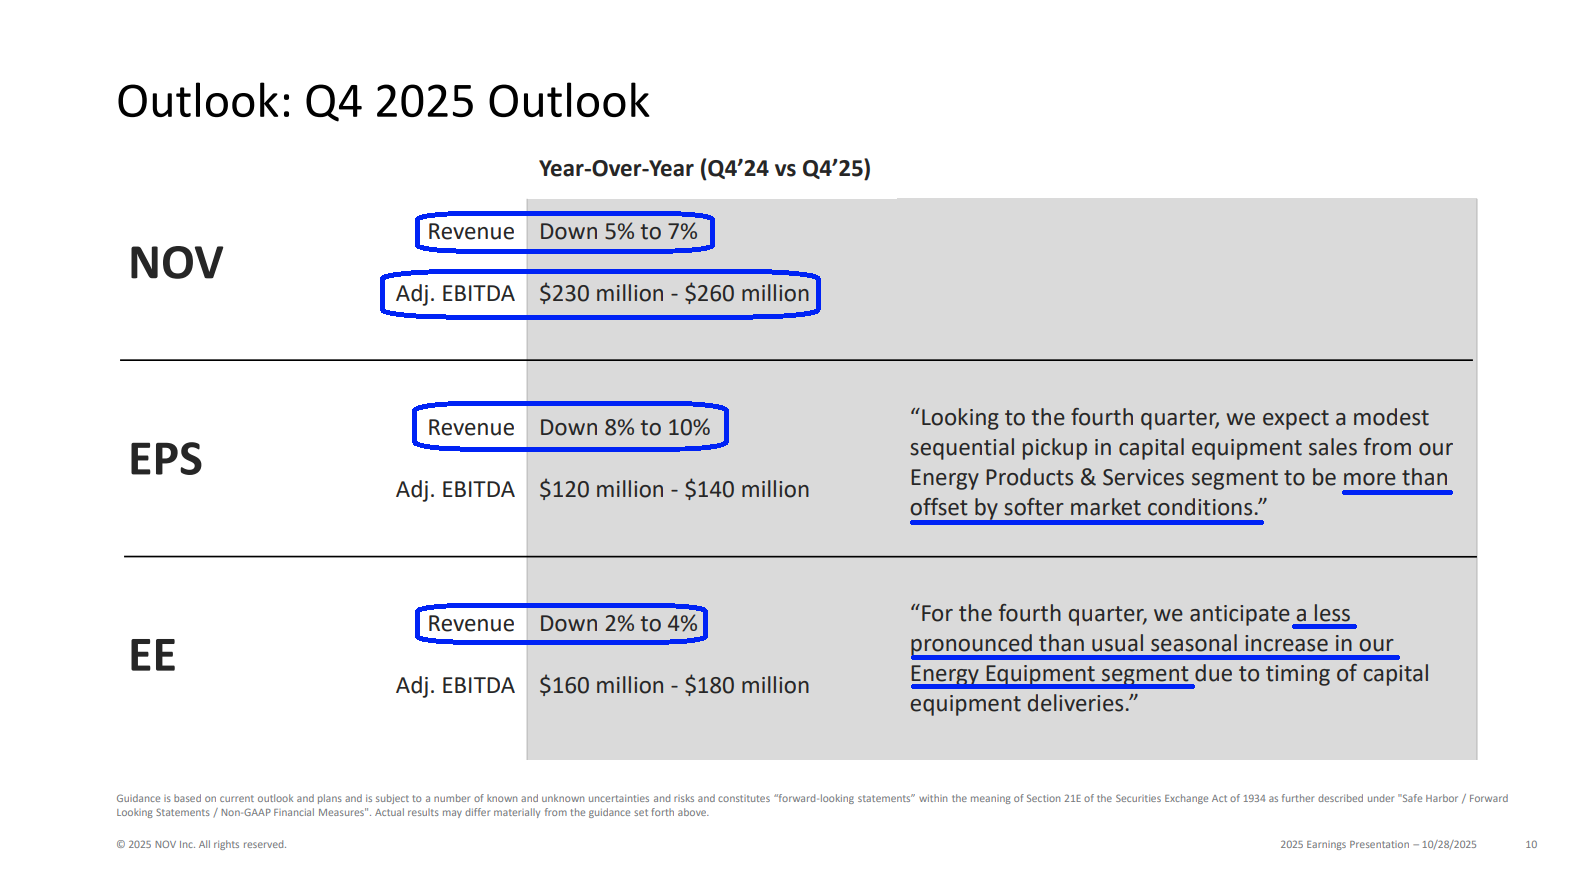
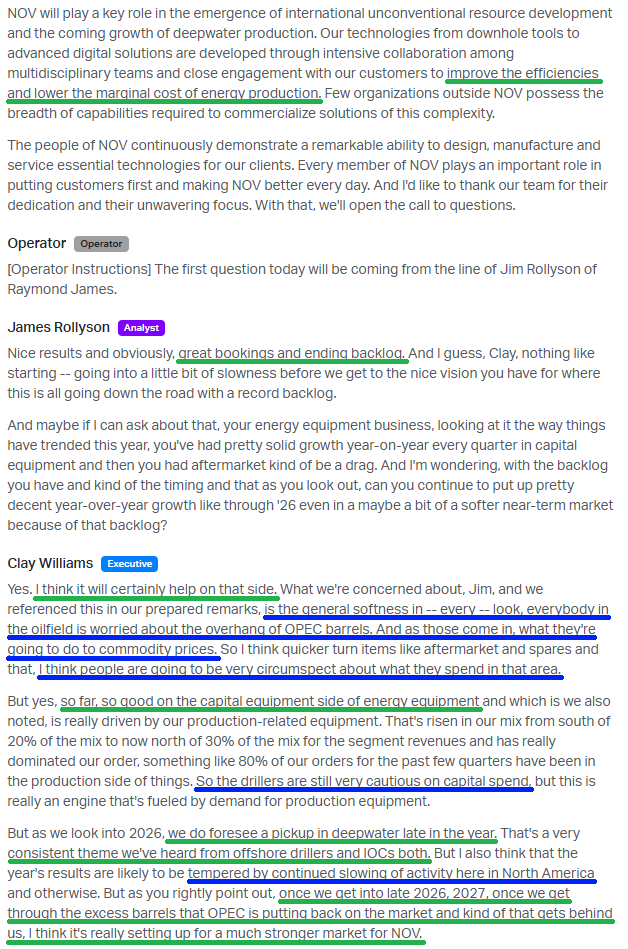
10) Management issued Q4 guidance, expecting consolidated revenues to decline 5–7% and adjusted EBITDA to come in between $230M and $260M, compared to $330M in the prior-year period. Soft market conditions, combined with a less pronounced-than-usual seasonal increase in Energy Equipment due to timing, are expected to weigh on results, with conditions likely remaining soft over the next few quarters. However, management expects the back half of 2026 to mark the start of a recovery and a period of strength for NOV as offshore activity ramps, unconventional international basins accelerate, and oversupply and commodity price pressures ease.
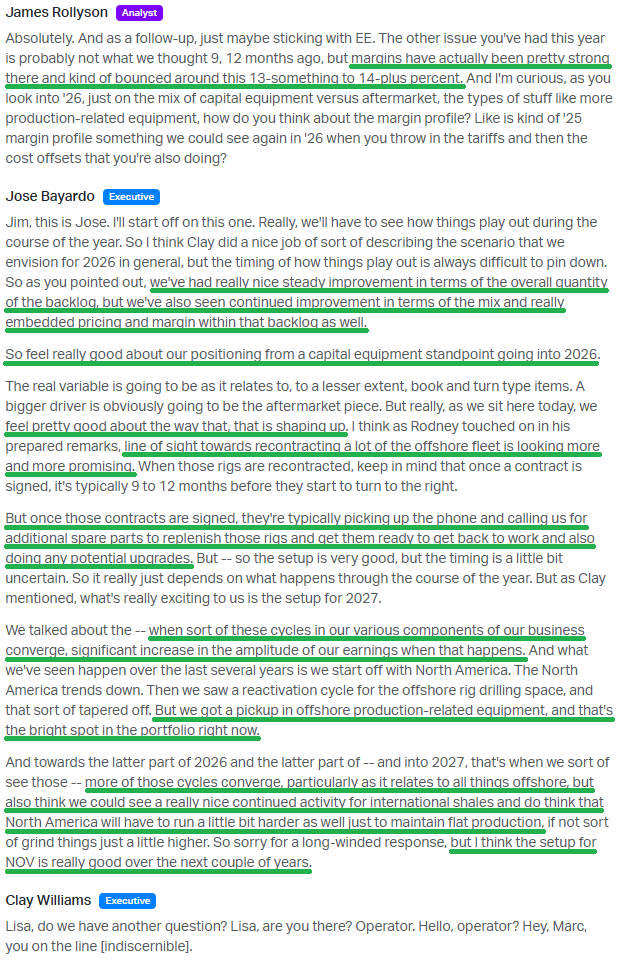
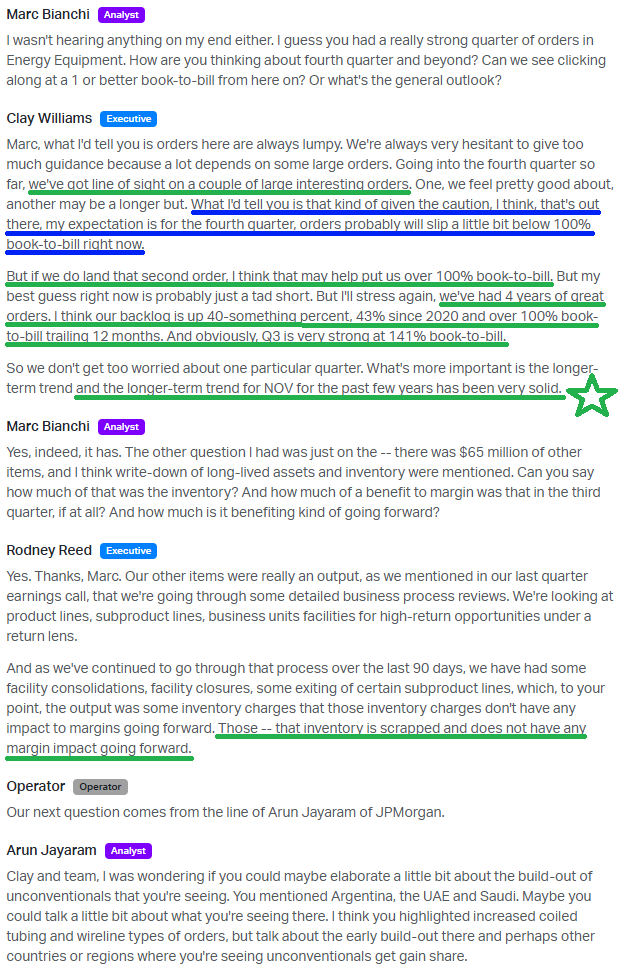
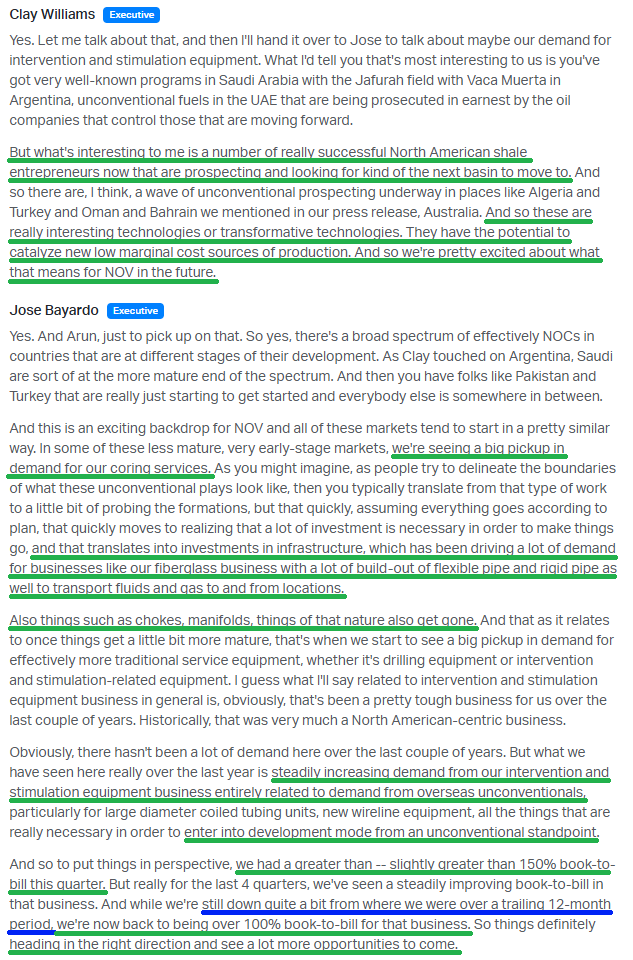
Earnings Call Highlights
Morningstar Analyst Note
General Market
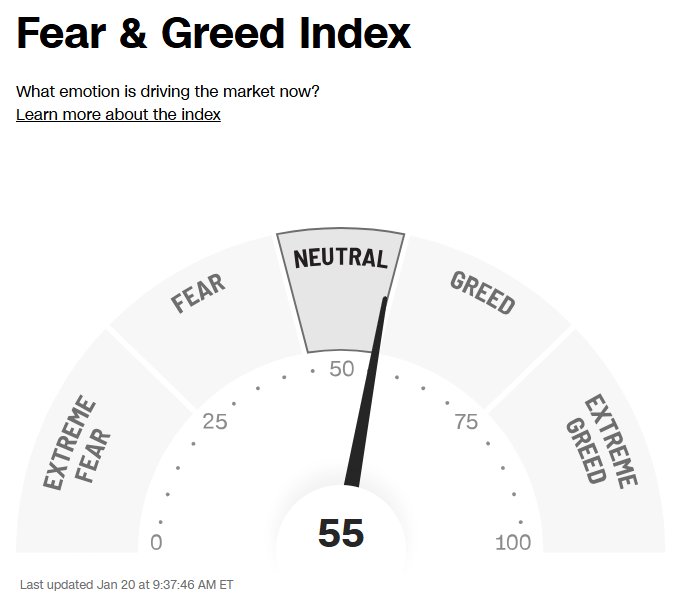
The CNN “Fear and Greed Index” ticked down to 55 this week from 58 last week. You can learn how this indicator is calculated and how it works here: (Video Explanation)
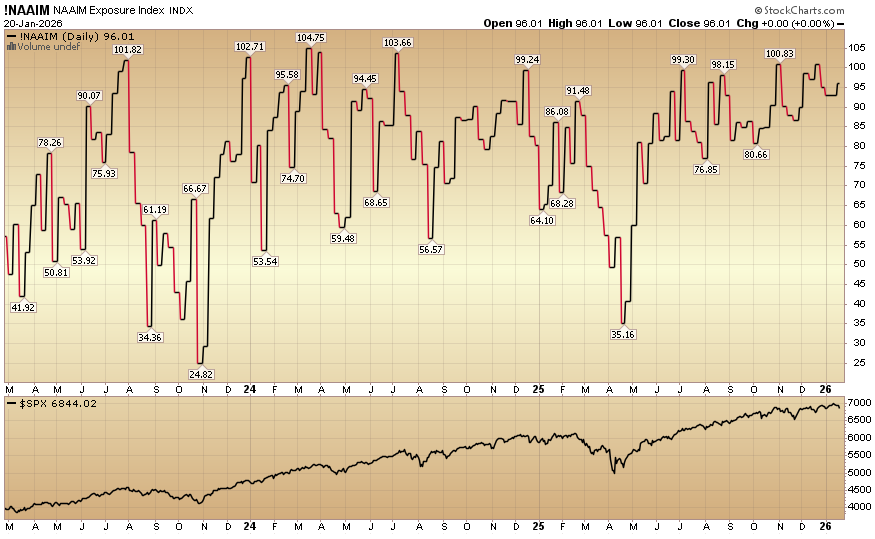
The NAAIM (National Association of Active Investment Managers Index) (Video Explanation) rose to 96.01% equity exposure this week from last week’s 92.93%.
Our podcast|videocast will be out sometime today. We have a lot of great data to cover this week. Each week, we have a segment called “Ask Me Anything (AMA)” where we answer questions sent in by our audience. If you have a question for this week’s episode, please send it in at the contact form here.
Larger accounts $5-10M+ can access bespoke service anytime here.
Not a solicitation.
More By This Author:
“When Boring Wins” Stock Market (And Sentiment Results)
“A Healthier Smile Ahead” Stock Market (And Sentiment Results)
“Turnaround On The Menu” Stock Market (And Sentiment Results)


Comments
Log in or sign up to join the conversation.