
The S&P 500 Trend Decoded: The Key Levels You Need To Know

Image Source: Unsplash
The volume of each downswing has been decreasing in S&P 500 off the key resistance level and the pullback is getting more bullish in terms of the characteristics.
Watch the video below to find out how to use the Wyckoff trading method together with the key levels you need to know to judge the immediate trend, short-term trend, and long-term trend of the S&P 500.
Video Length: 00:09:25
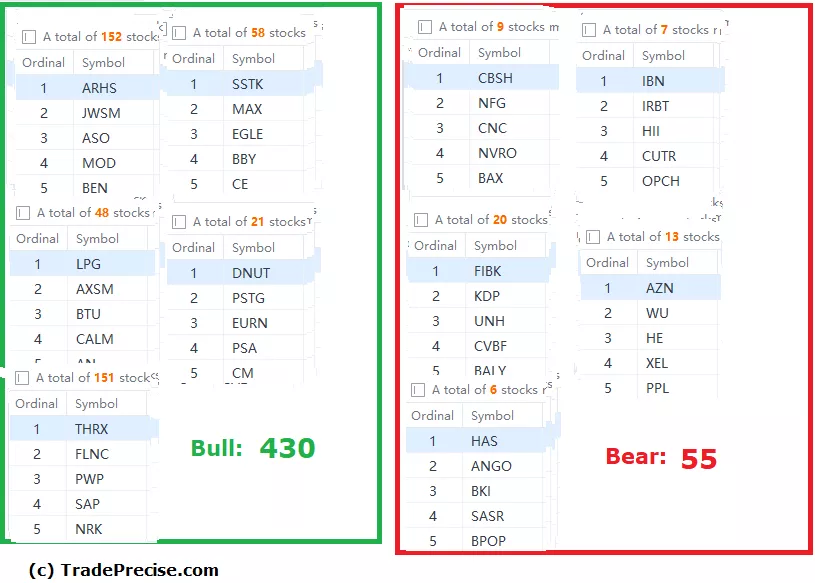
The bullish setup vs. the bearish setup is 430 to 55 from the screenshot of my stock screener below. Despite the pullback and bad market sentiment before the FOMC announcement on 30 Jan 2023, the number of the bullish setup still suggested a positive market environment.
The leading index, Russell 2000 broke above the key resistance. If there is a follow-through to the upside after the FOMC rate hike announcement, that will act as a key change of character of the stock market.
More By This Author:
Is Nvidia Roaring Back With Buzz Of Artificial Intelligence?
Here Are The Bullish Tell-Tale Signs Detected In S&P 500 And What To Watch For
A New Bull Run Could Be Triggered Based On Market Breadth
Disclaimer: The information in this presentation is solely for educational purpose and should not be taken as investment advice.


