
Here Are The Bullish Tell-Tale Signs Detected In S&P 500 And What To Watch For
The pullback reversal at the axis line in conjunction with Wyckoff’s efforts vs results suggested presence of demand.
![]()
Watch the video below to find out how to use the Wyckoff method to detect the bullish subtle changes in S&P 500 and what to expect next for the bullish scenario and when it will be violated.
Video Length: 00:11:04
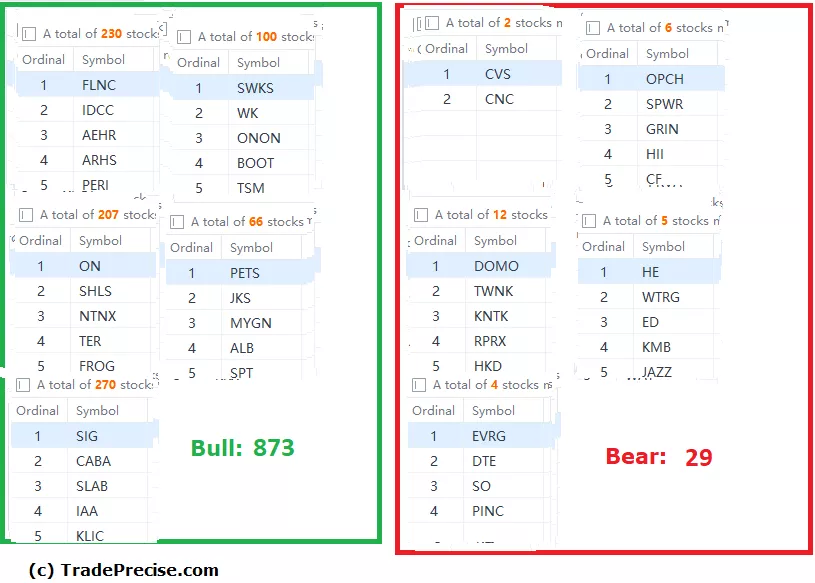
The bullish setup vs. the bearish setup is 873 to 29 from the screenshot of my stock screener below. This is another positive sign, which is inline with the improving market breadth to support the bull case on top of the bullish changes in the price action.
As the S&P 500 attempts to break above the supply line of the down channel, pay attention to the possible reaction as illustrated in the video for the bullish case and where the failure could occur.
More By This Author:
A New Bull Run Could Be Triggered Based On Market Breadth
Could VIPS Continue Its Bullish Momentum After 140% Rally Since October?
Does Alibaba Have What It Takes To Rally 200% Back To Its All-Time High?
Disclaimer: The information in this presentation is solely for educational purpose and should not be taken as investment advice.


