The Q2 Earnings Season Kicks Off
Image Source: Unsplash
The June quarter earnings reporting cycle will start grabbing the market’s attention this week, with JPMorgan (JPM - Free Report) and the other big banks coming out with their Q2 results.
Banks have been going through a tough stretch over the last few months, with the Silicon Valley Bank blowup triggering a speculative frenzy about the next banking victim in the regional banking space. While the immediate pressure has eased and market sentiment on the group has improved, the issue is still very much with us.
The big money-center players like JPMorgan have been beneficiaries of the regional bank crisis, as their perceived safety has allowed them to absorb a big part of the deposits fleeing the regionals. We will see this in the Q2 earnings reports from JPMorgan and the others.
In addition to JPMorgan, we will see Q2 results from Citigroup (C - Free Report) and Wells Fargo (WFC - Free Report) before the market’s open on Friday, July 14th.
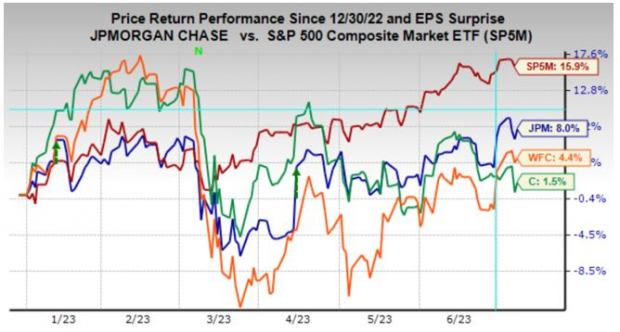
These stocks have lagged behind the broader market, particularly since the early March 2023 onset of the aforementioned regional bank worries, as the chart below shows.

Image Source: Zacks Investment Research
While these banking leaders are exposed to the same macroeconomic forces, they also have company-specific issues to contend with. Citigroup, in particular, has been going through a seemingly never-ending restructuring, and uncertainty on that front accounts for its underperformance. Wells Fargo appears to have finally put the regulatory issues behind it, but it is far less of a money-center player and more of a jumbo regional operator with a big housing exposure.
The expectation is for JPMorgan’s Q2 earnings to be up +23.6% on +20.6% higher revenues. For Citigroup, Q2 earnings are expected to be down -40.7% from the same period last year on +0.2% higher revenues, while the same for Wells Fargo is for +39.9% and +19.1% growth, respectively.
The Zacks Major Banks industry, of which all three of these banks are a part, is expected to have +3.8% higher earnings in Q2 relative to the year-earlier period on +11.9% higher revenues. This industry is the largest earnings contributor to the Finance sector, accounting for almost 46% of the sector’s total earnings and nearly double the earnings contribution of the second biggest earnings contributor, which is the Insurance industry.
For the Finance sector as a whole, total Q2 earnings are expected to be up +11.1% from the same period last year on +6.3% higher revenues.
The table below shows current earnings and revenue growth expectations for the Finance sector’s constituent mezzanine-level industries.

Image Source: Zacks Investment Research
In addition to conventional banking activities, these money-center operators are big investment banking and asset management players with enormous trading operations. The investment banking business has been down for the last few quarters, and Q2 was no different, though more recent activities suggest some ‘green shoots’ on that front. The trading business will also be down relative to last year’s record volumes.
All of the profitability gains will be due to the core banking business, with growing loan portfolios and expanded margins helping them enjoy strong net interest income gains. Loan growth is expected to remain positive, though growth is projected to be below the preceding quarter’s pace as demand moderates in response to tighter Fed policies.
On the earnings calls, the focus will likely be on trends in loan demand, the health of commercial real estate, credit quality trends, and the health of the overall economy.
The Earnings Big Picture
Regular readers of our earnings commentary know that we have consistently flagged a favorable turn in the revisions trend since the start of 2023 Q2. Earnings estimates have been stabilizing in the aggregate after consistently coming down for almost a year and have actually started to go up for some key sectors.
This combination of favorable macroeconomic developments and optimism about the transformational power of artificial intelligence (AI) appears to be driving market optimism.
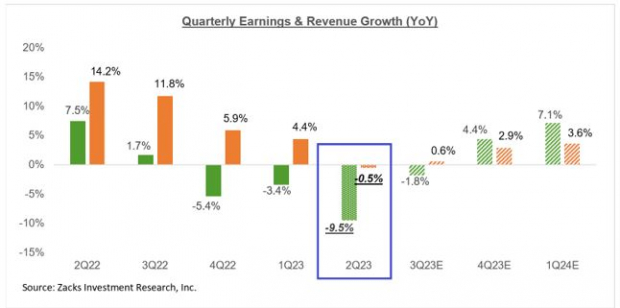
To get a sense of what is currently expected, take a look at the chart below that shows current earnings and revenue growth expectations for the S&P 500 index for 2023 Q2 and the following three quarters and actual results for the preceding four quarters.

Image Source: Zacks Investment Research
The -9.5% decline in Q2 earnings today is down from -7.2% at the start of the quarter, with estimates for 12 of the 16 Zacks sectors coming down. The biggest cuts to earnings estimates have been for the Energy, Aerospace, and Consumer Discretionary sectors.
On the positive side, Q2 earnings estimates increased for the Transportation, Tech, Construction, and Industrial Products sectors.
Please note that while 2023 Q2 estimates have come down, the magnitude of negative revisions compares favorably to what we saw in the comparable periods of the preceding couple of quarters. In other words, estimates haven’t fallen as much as they did the last few quarters, not only for Q2 but also for the rest of the year.
As noted earlier, we have been pointing out a notable stabilization in the revisions front lately, which roughly coincided with the start of Q2 in April 2023. This was a shift in the overall revisions trend that had been in place for almost a year prior.
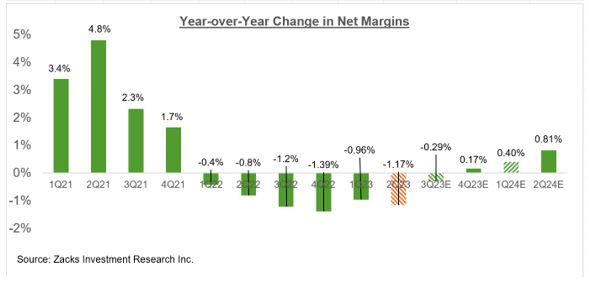
Returning to the 2023 Q2 expectations, embedded in the aforementioned earnings and revenue growth projections is the expectation of continued margin pressures, a recurring theme in recent quarters.
The chart below shows the year-over-year change in net income margins for the S&P 500 index.

Image Source: Zacks Investment Research
As you can see above, 2023 Q2 will be the 6th consecutive quarter of declining margins for the S&P 500 index.
Margins in Q2 are expected to be below the year-earlier level for 11 of the 16 Zacks sectors, with the biggest margin pressure expected to be in the Basic Materials, Construction, Energy, Medical, Conglomerates, Autos, Aerospace, and Tech sectors.
On the positive side, the Finance sector is the only one expected to experience significant margin gains, with the Consumer Discretionary sector as a distant second. Sectors expected to be essentially flat margins relative to 2022 Q2 are Retail, Utilities, and Industrial Products.
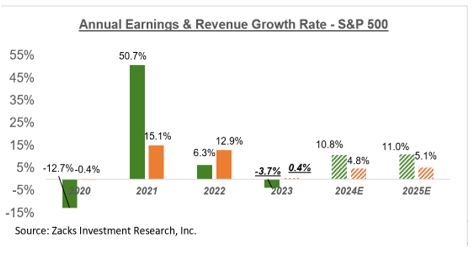
The chart below shows the earnings and revenue growth picture on an annual basis.

Image Source: Zacks Investment Research
As noted earlier in the context of discussing the revisions trend of 2023 Q2 estimates, we have been observing a notable stabilization in the revisions trend since the start of April 2023.
This stabilization in 2023 earnings estimates represented a notable reversal in the persistently negative trend that had been in place for almost a year. Current expectations for 2023, as represented by the above chart, are down -13.5% since the April 2022 peak.
Since the start of 2023 Q2 in April, aggregate earnings estimates for 2023 are essentially flat, with 9 of the 16 Zacks sectors enjoying positive estimate revisions in that time period. Sectors enjoying positive estimate revisions since the start of Q2 include Construction, Industrial Products, Autos, Tech, and Retail.
Q2 Earnings Scorecard
The Q2 earnings season will really get going with the July 14th quarterly release from JPMorgan and the other big banks. But the Q2 reporting cycle has officially gotten underway already, with results from 18 S&P 500 members out. All of these 18 index members have fiscal quarters ending in May, which we and other data vendors count as part of the June-quarter tally.
In fact, by the time JPMorgan comes with its quarterly results, we will have seen such Q2 results from almost two dozen S&P 500 members. Among these 18 index members that have reported already are bellwether operators like Nike, FedEx, Adobe, and others. We have 11 index members on deck to report results, including the aforementioned big banks.
Total Q2 earnings for these 18 index members are down -21.5% from the same period last year on +0.6% higher revenues, with 83.3% beating EPS estimates and 66.7% beating revenue estimates.
This is too small and unrepresentative of a sample to draw any conclusions from. Still, the comparison charts nevertheless put the Q2 results from these 18 index members with what we had seen from the same group of companies in other recent periods.

Image Source: Zacks Investment Research
More By This Author:
The Earnings Picture Refuses To Weaken
Q2 Earnings: What Can Investors Expect?
Q2 Earnings: An Early Preview
Disclosure: Zacks.com contains statements and statistics that have been obtained from sources believed to be reliable but are not guaranteed as to accuracy or completeness. References to any specific ...
more


