
The One Signal That Could Flip It

Image Source: Unsplash
Find out why the S&P 500’s rally is still intact, the key levels to watch, and what signals could trigger the next pullback.
Watch the video from the WLGC session on 23 Sep 2025 to find out the following:
- How to spot exhaustion signals that warn of a short-term pullback.
- The volume patterns that traders should watch for a market pullback.
- The one red flag for the current rally you need to know.
- The key level that could flip the current bullish momentum.
- And a lot more…
Video Length: 00:04:04
Market Environment
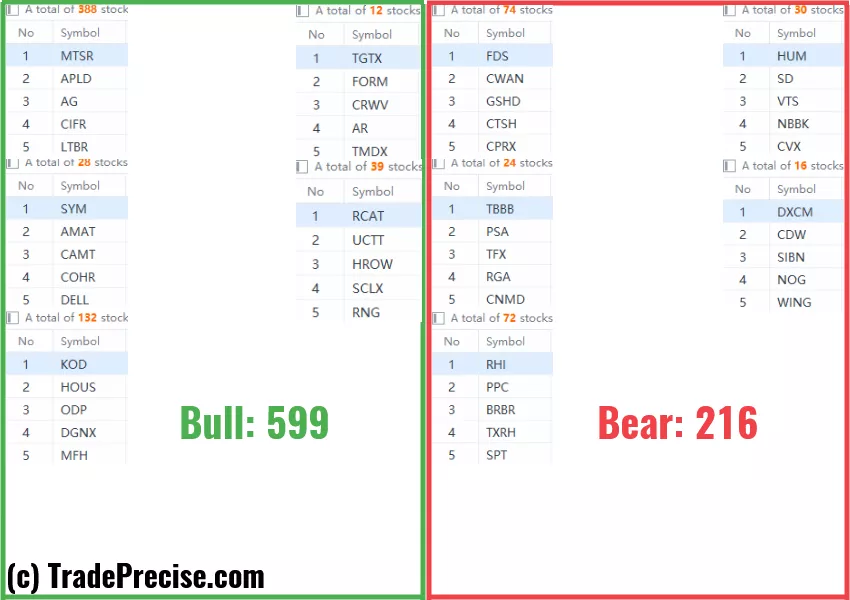
The bullish vs. bearish setup is 599 to 216 from the screenshot of my stock screener below.
(Click on image to enlarge)
3 Stocks Ready To Soar
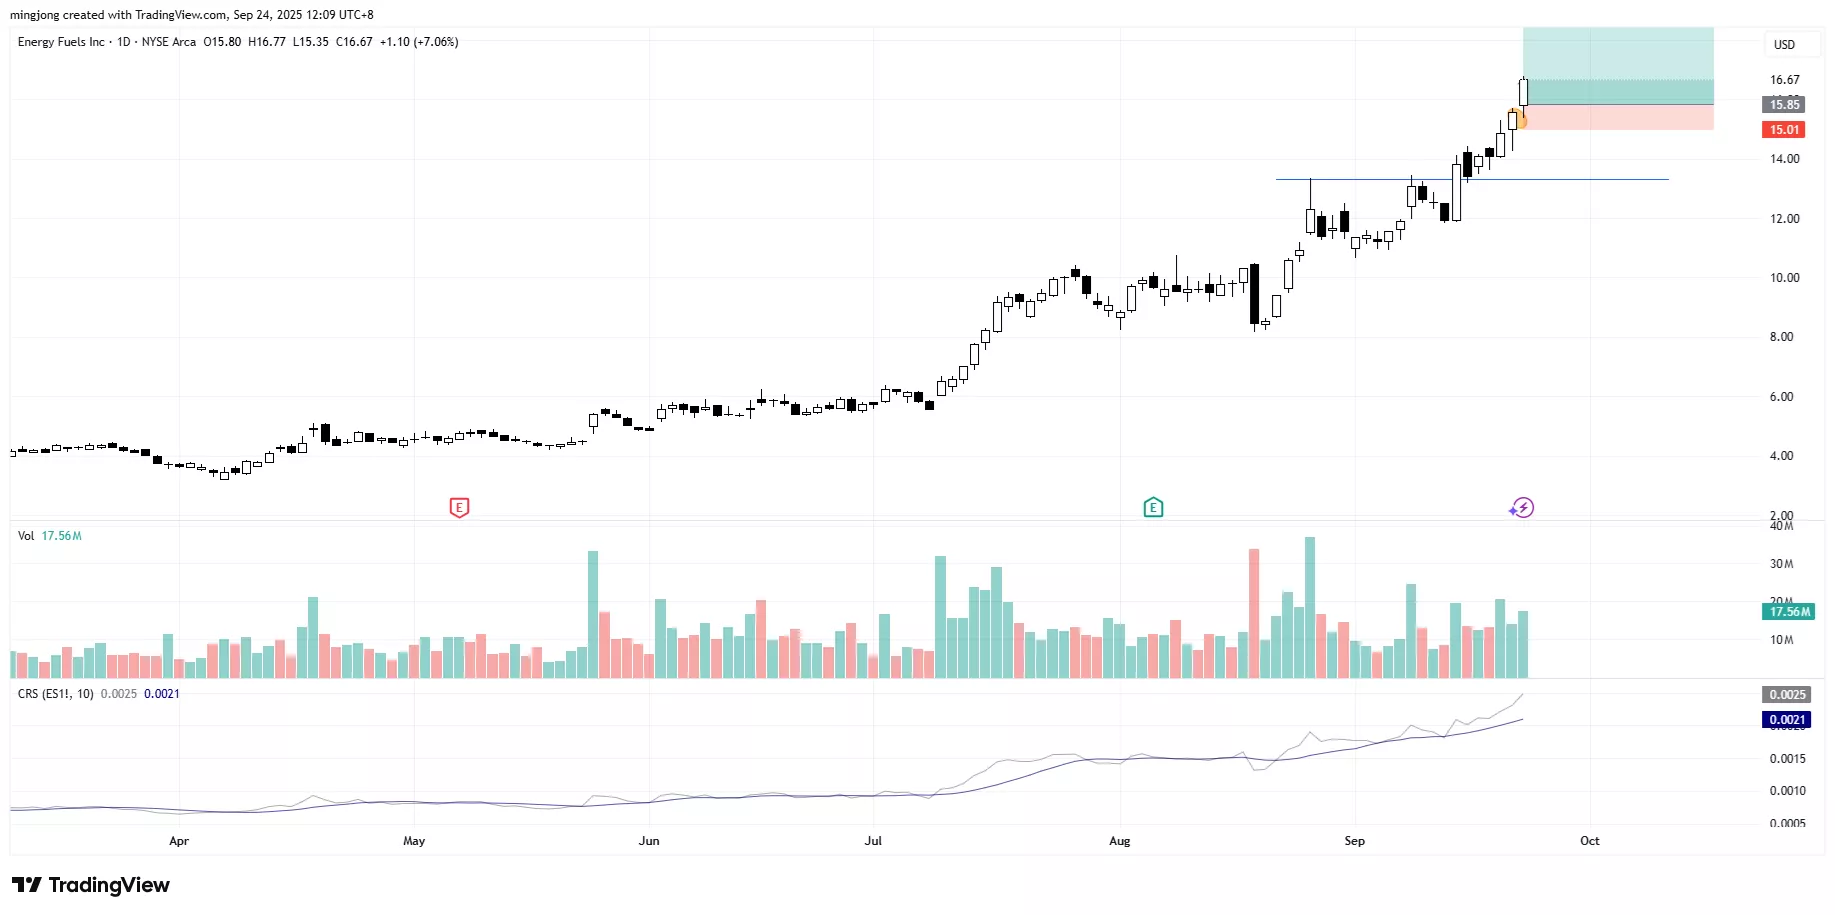
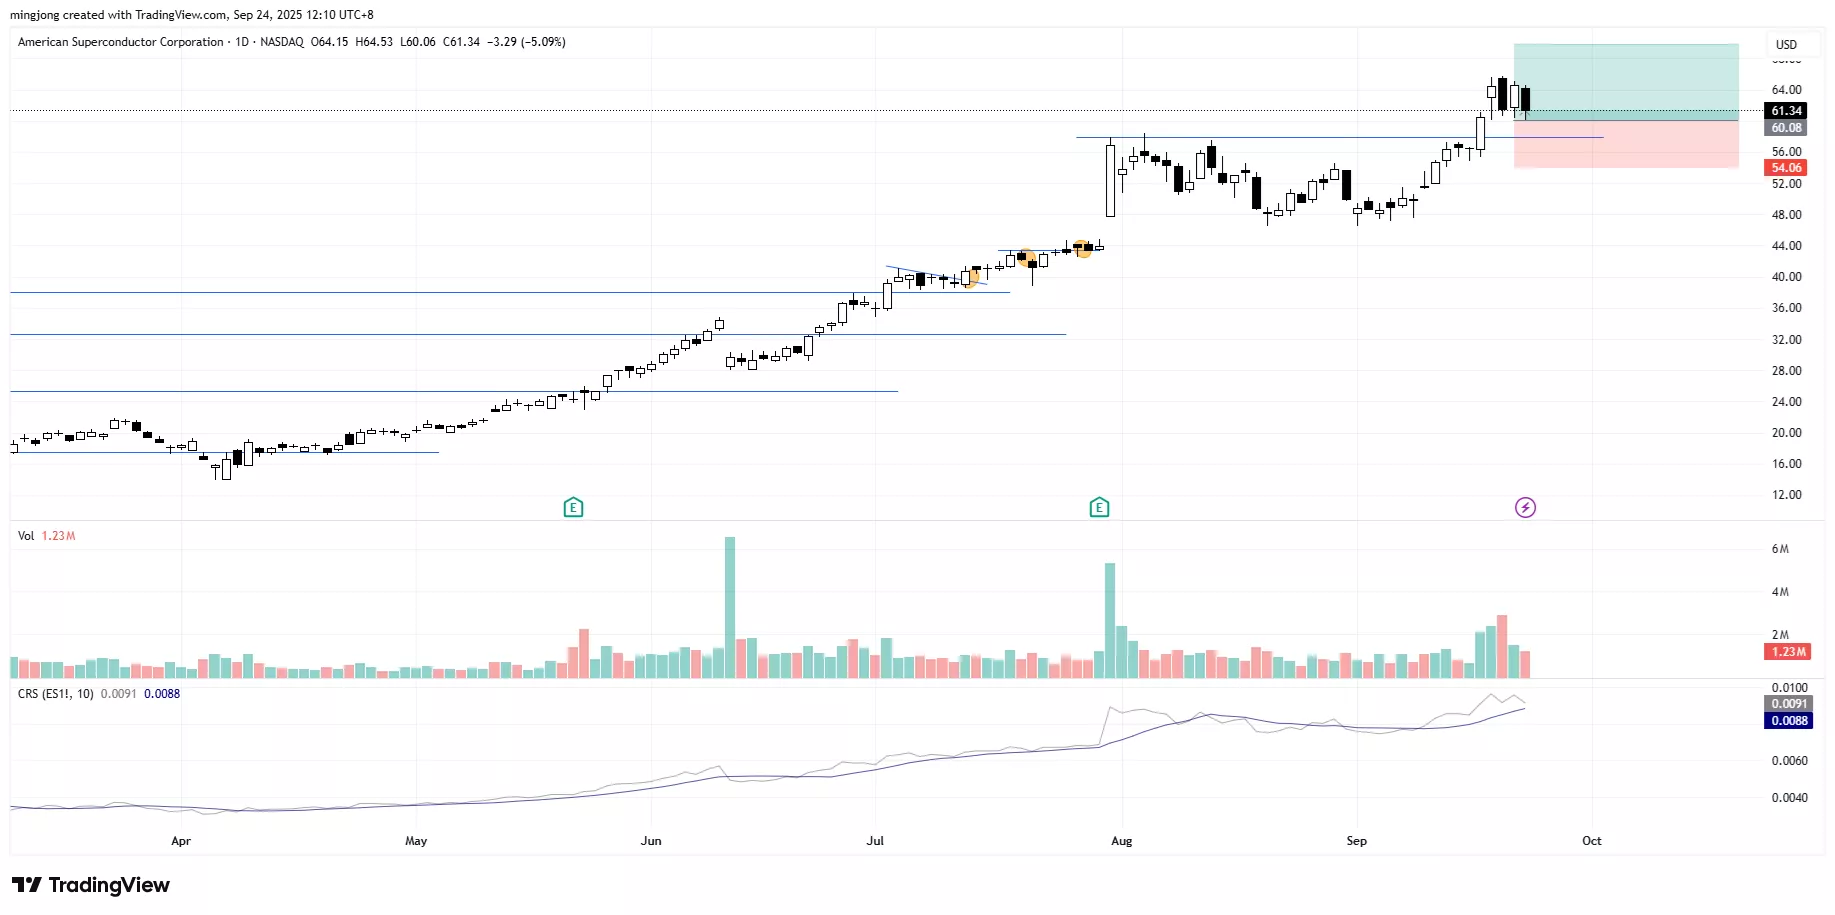
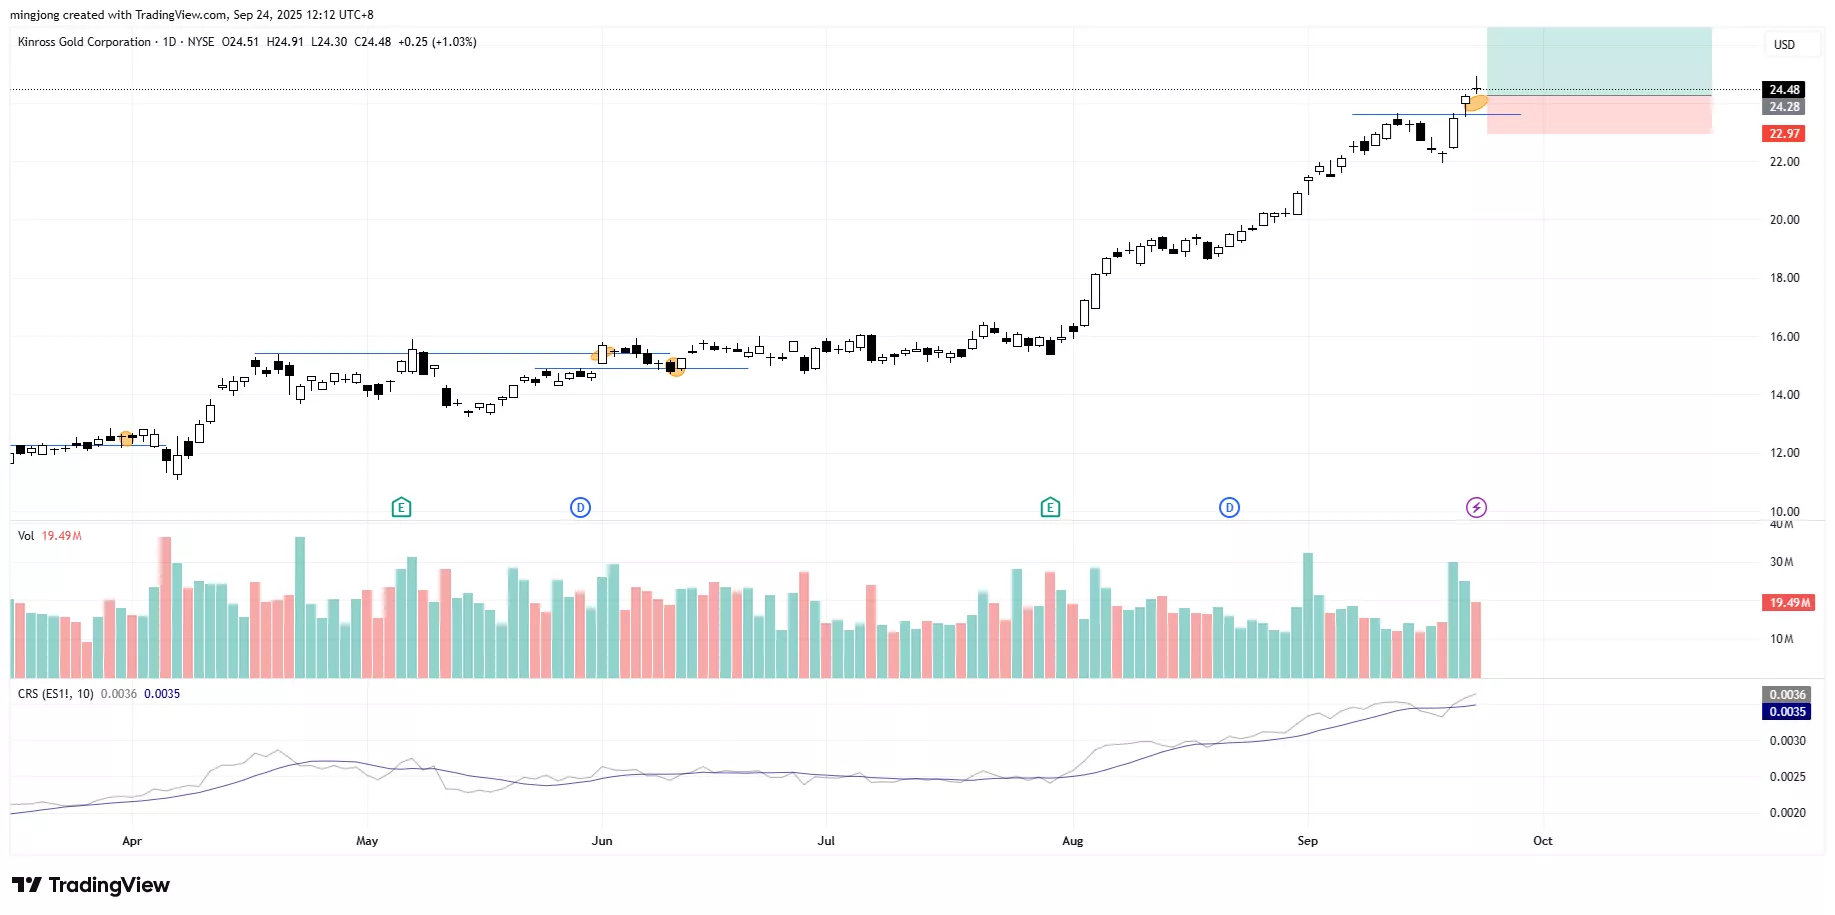
24 actionable setups such as UUUU, AMSC, KGC were discussed during the live session on 23 Sep 2025 before the market open (BMO).
(Click on image to enlarge)
(Click on image to enlarge)
(Click on image to enlarge)
More By This Author:
Why One ‘Momentum Bar’ Could Decide The Fate Of The S&P 500 Rally
Potential Pause In Gold Futures Rally? Here's What Wyckoff Effort Vs. Results Reveals
September’s Market Curse? S&P 500 Faces Make-Or-Break Test At This Key Support
Disclaimer: The information in this presentation is solely for educational purpose and should not be taken as investment advice.


