
Potential Pause In Gold Futures Rally? Here's What Wyckoff Effort Vs. Results Reveals

Image Source: Unsplash
Gold and silver are breaking out with powerful momentum — but hidden supply signals on the charts could reveal the next big move before anyone else sees it.
Watch the video from the WLGC session on 9 Sep 2025 to find out the following:
- How Wyckoff effort vs. results analysis exposes early signs of supply entering the market.
- How to spot the early weakening momentum signal in Gold futures.
- The target price for Silver upon the completion of a bull flag pattern.
- The similarities in Gold and Silver that long-term investors must know to maximize profit.
- And a lot more…
Video Length: 00:02:37
Market Environment
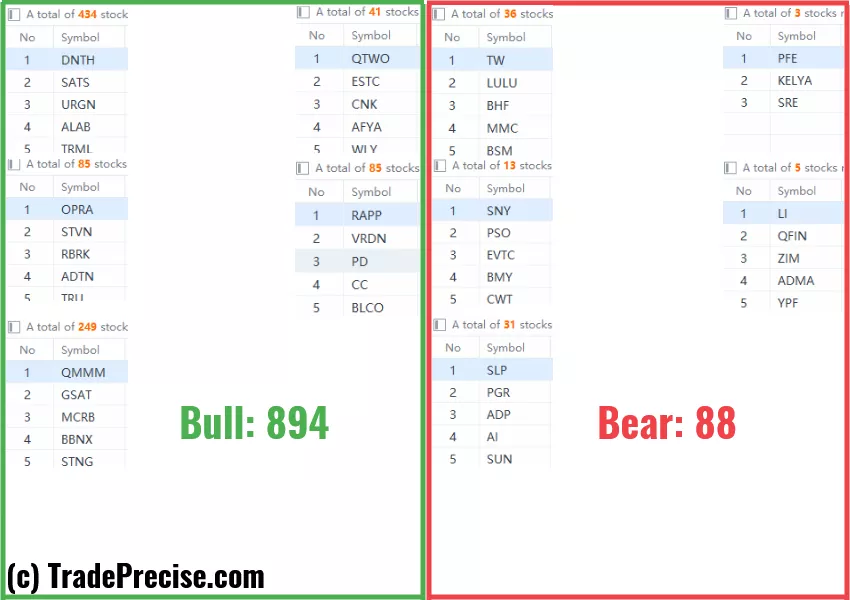
The bullish vs. bearish setup is 894 to 88 from the screenshot of my stock screener below.
(Click on image to enlarge)
3 Stocks Ready To Soar
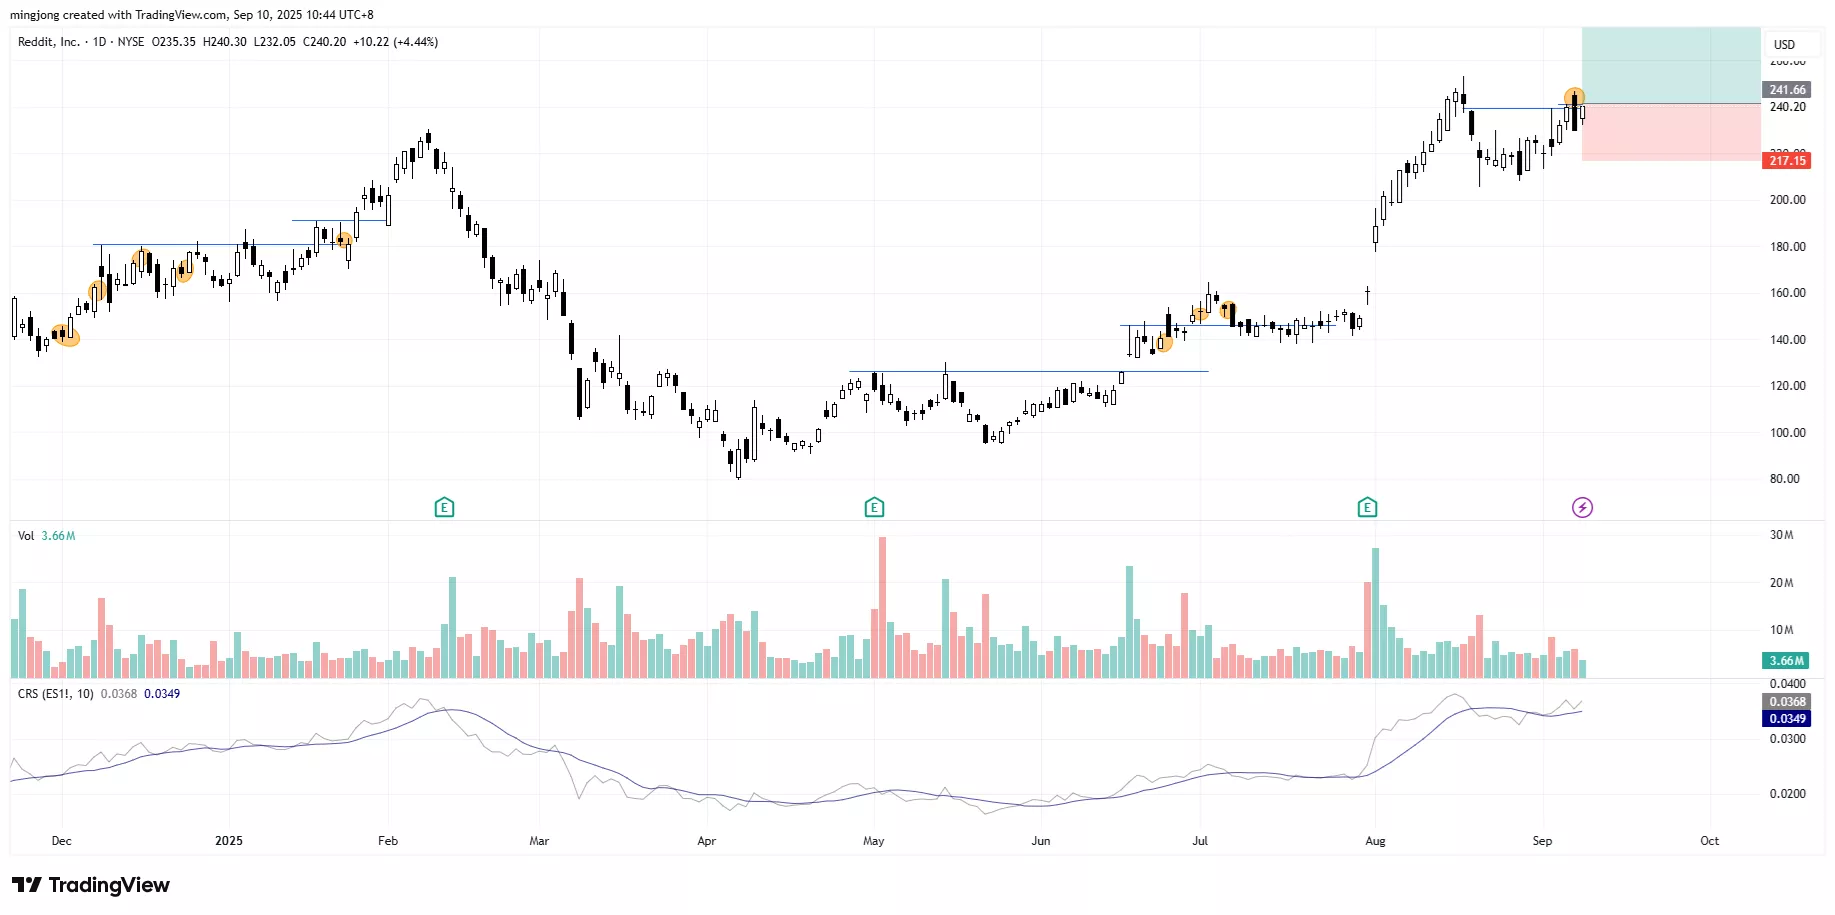
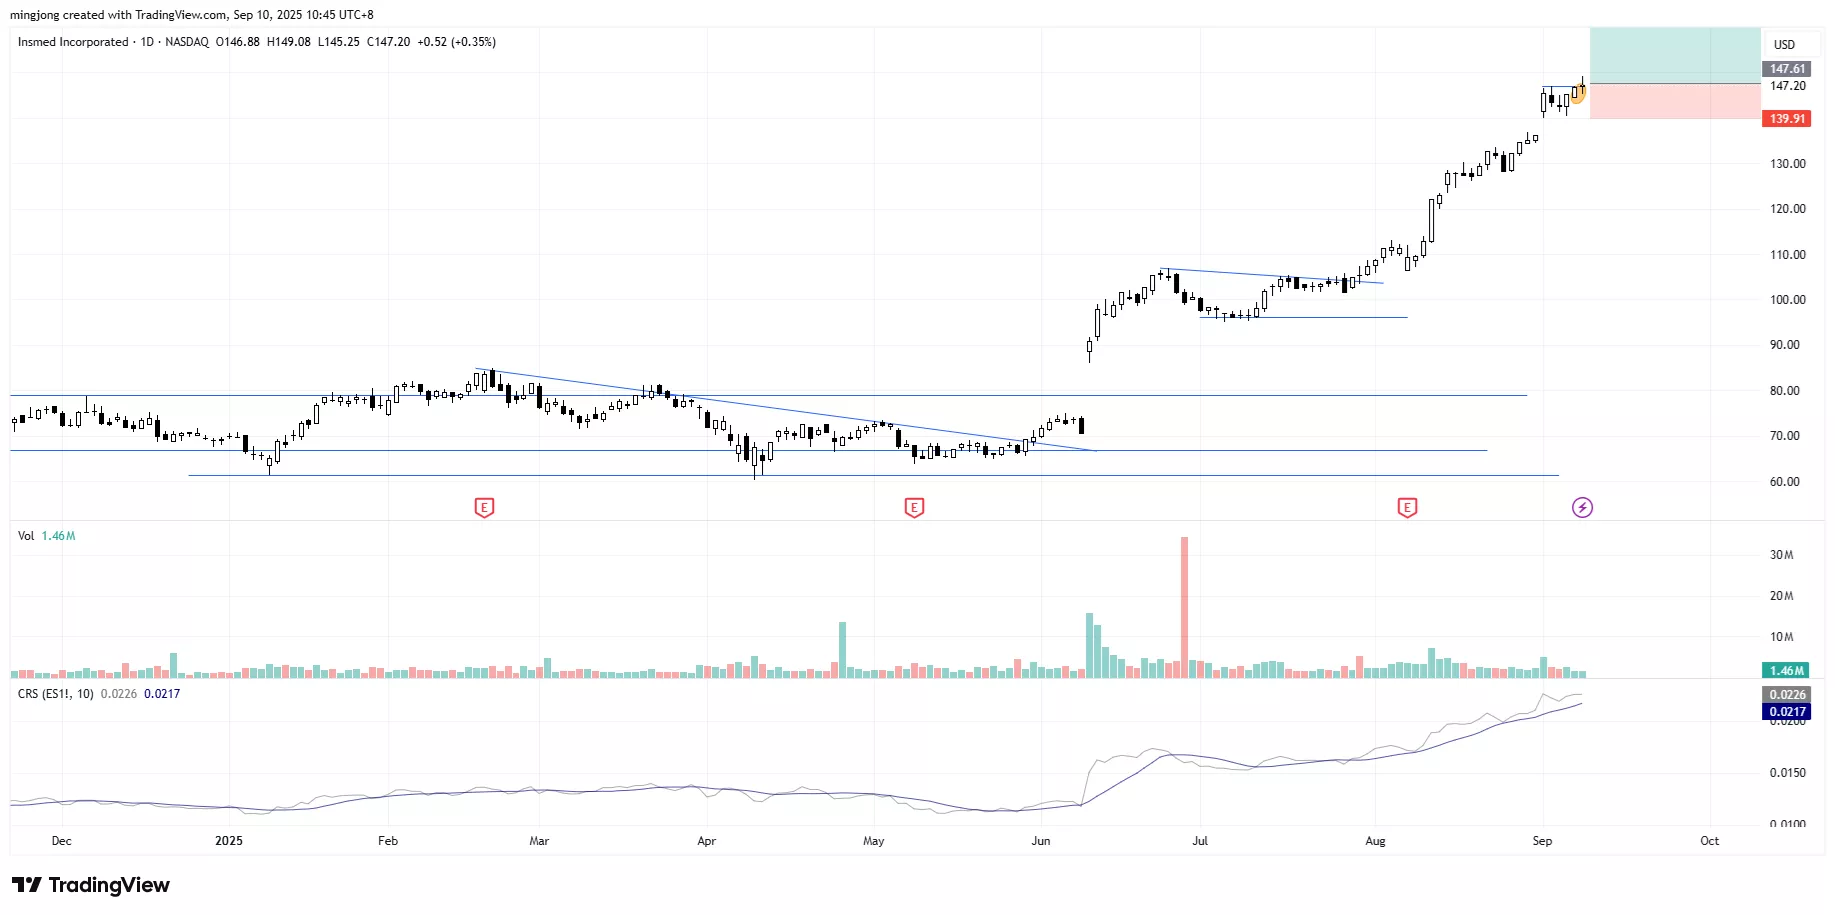
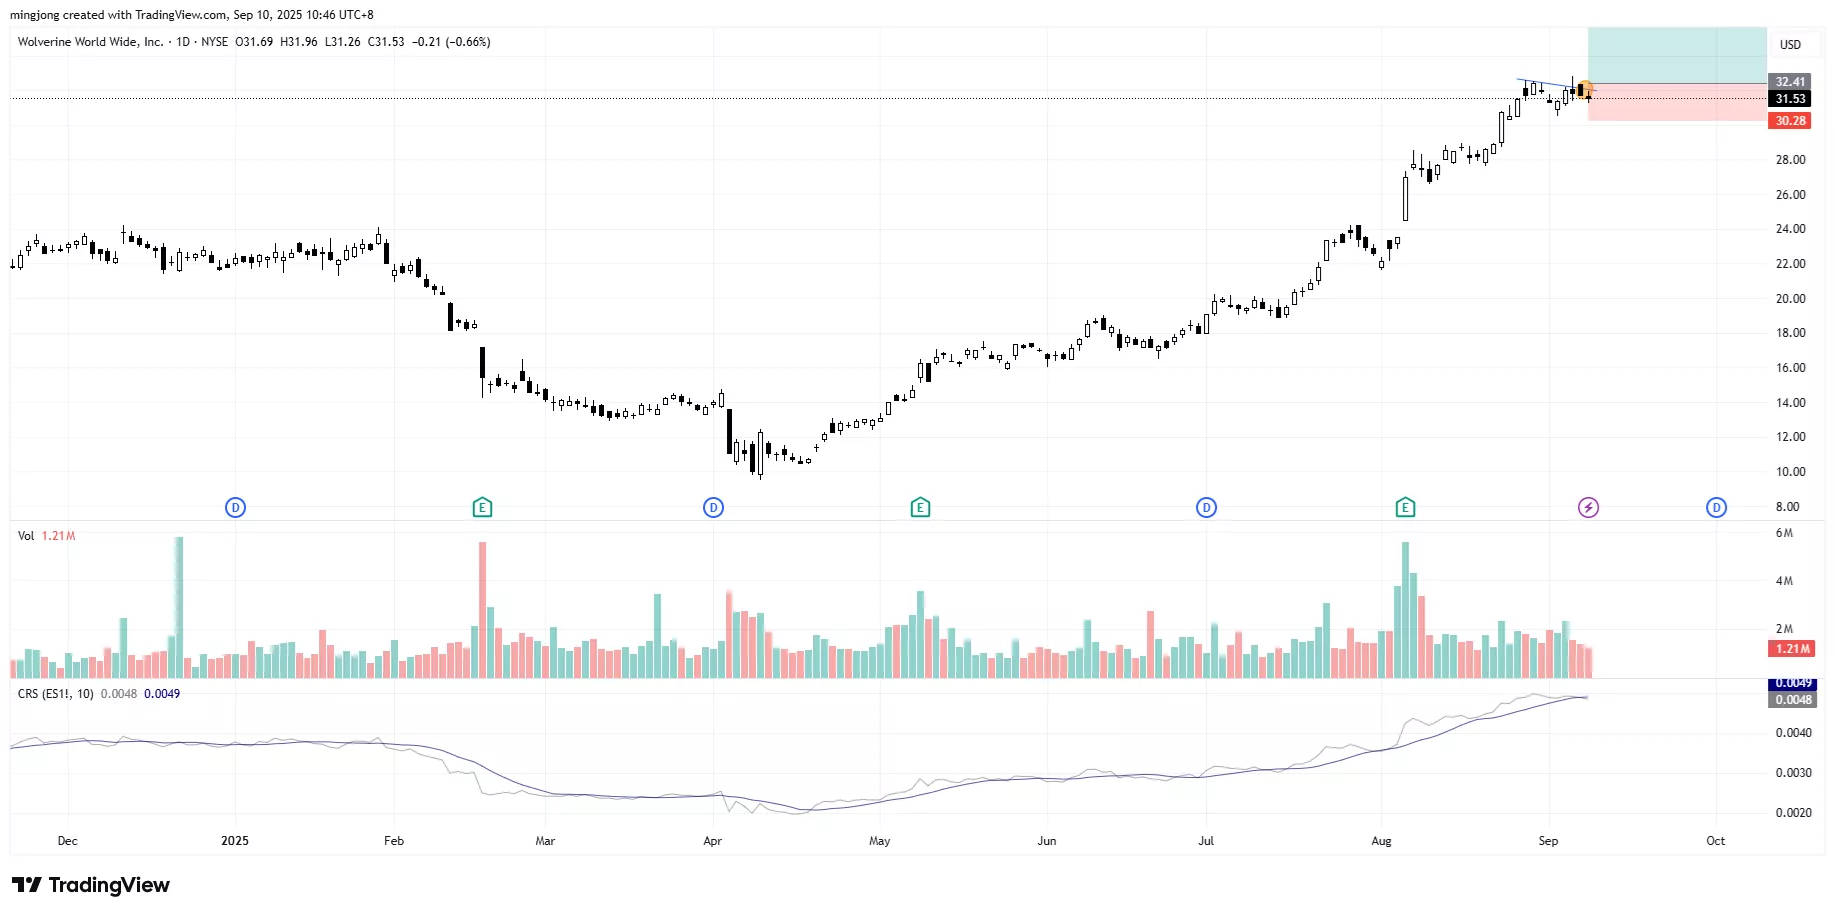
23 actionable setups such as RDDT, INSM, WWW were discussed during the live session on 9 Sep 2025 before the market open (BMO).
(Click on image to enlarge)
(Click on image to enlarge)
(Click on image to enlarge)
More By This Author:
September’s Market Curse? S&P 500 Faces Make-Or-Break Test At This Key Support
This Bullish Rotation To Russell 2000 Could Change Everything
History Shows Gains Can Vanish In Just 2 Days — Is S&P 500 About To Repeat The Same Wipeout?
Disclaimer: The information in this presentation is solely for educational purpose and should not be taken as investment advice.


