

Above: Nvidia CEO Jensen Huang giving his signature to a fan.
Nvidia
Nvidia has been all the rage – and justifiably so. Since NVDA reported its Q1 2023 earnings report and disclosed the huge demand for its AI chips, the stock has gone straight up. Now it’s worth $3.3T. Revenues up 4x, margin expansion, everything anyone could ever wish for.
As the stock went up, bulls exclaimed, it’s getting “cheaper” because as earnings grew, the multiple came down. But now we have a different landscape – one of decelerating growth. Quarterly revenue growth has gone from 88% to 34% to 18% and on its way to single digits. Now the multiple is re-accelerating into slowing growth. Next quarter revenue growth guidance is just 7%.
All of the marginal buyers are in – sucking the last few retail buyers in with the lure of a split. History suggests a short term bump after a split as we are seeing, but now institutional investors have a vast pool to distribute their shares in coming months. As the saying goes, “when the ducks are quacking, feed them.”
If the quarterly revenue growth continues to moderate, earnings growth will be impacted as well – making the stock become more and more “expensive” (multiple screams higher) versus the theme of last year when the higher it climbed the “cheaper” it got.
This does not change the fact that it is a great business with a great leader – which will play a role in the advance of AI technologies and productivity. It’s just going to be a heavy lift that it retains a perception of greater value than Amazon, Microsoft or the entire German Stock Market Capitalization (where it trades now).
NVDA is still a semiconductor company, which has never been a secular business – it’s cyclical. Always has been, always will be. As for 70%+ gross margins, as Bezos famously said, “your margin is my opportunity.” NVDA has not cured cancer. There will be more and more competition going forward. Intel’s Gaudi 3 is 50% faster than NVDA’s H100 and 40% more energy efficient. AMD is gunning for them. The game is just beginning and NVDA will be forced to share the pie as no buyer wants to be beholden to one company. NVDA is a great company and will continue to innovate. We are in an AI/productivity revolution. I would never bet against it. However…
“Price is what you pay, value is what you get…” Caveat emptor at these levels. What may go even higher in the short term can go a lot lower in a blink. The table is set.
When distribution to the great unwashed begins, keep in mind – in the wise words of Ernest Hemingway, “It occurs first very slowly, then all at once…”
Yahoo! Finance
On Monday I joined Alexandra Canal on Yahoo! Finance to discuss markets, stocks and more. Thanks to Sydnee Freid, Sarah Smith and Alexandra for having me on. You can watch it here:
Watch in HD directly on Yahoo! Finance
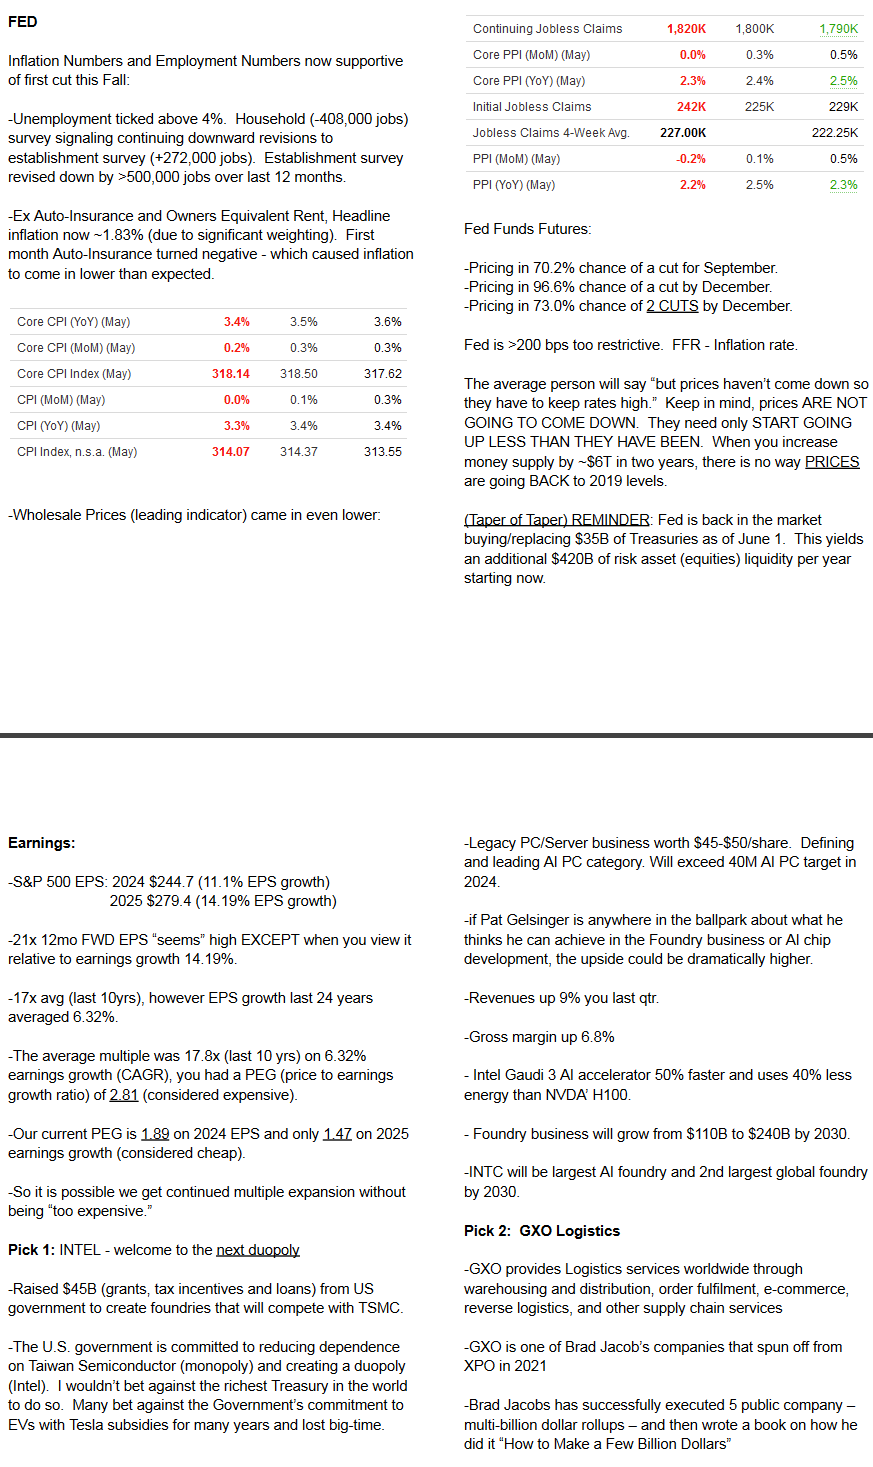
Here were my notes ahead of the segment:
(Click on image to enlarge)
(Click on image to enlarge)

(Click on image to enlarge)
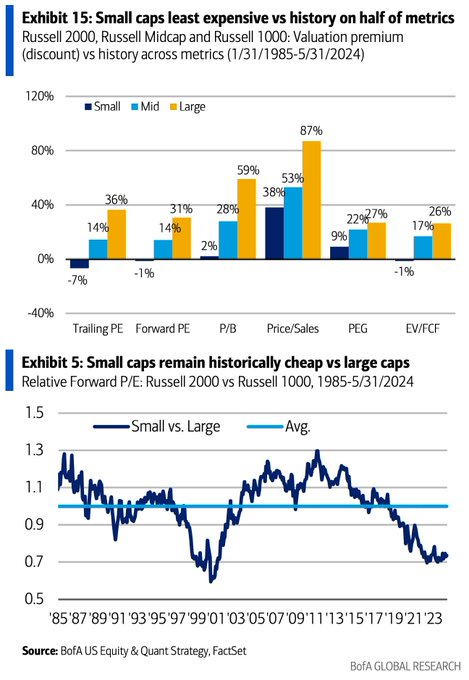
Data on Small Caps:
(Click on image to enlarge)
(Click on image to enlarge)
Source: Bank of America
(Click on image to enlarge)
(Click on image to enlarge)
Channel News Asia
On Tuesday I joined Elizabeth Neo on CNA to discuss markets, stocks and more. Thanks to Marianne Star Inacay and Liz for having me on. You can watch it here:
Watch in HD directly on Channel News Asia
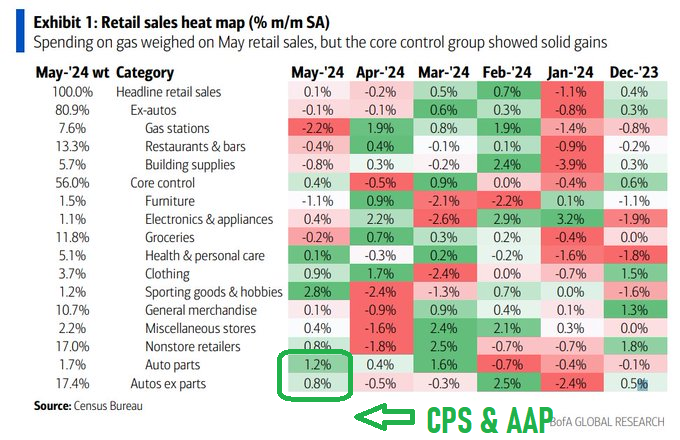
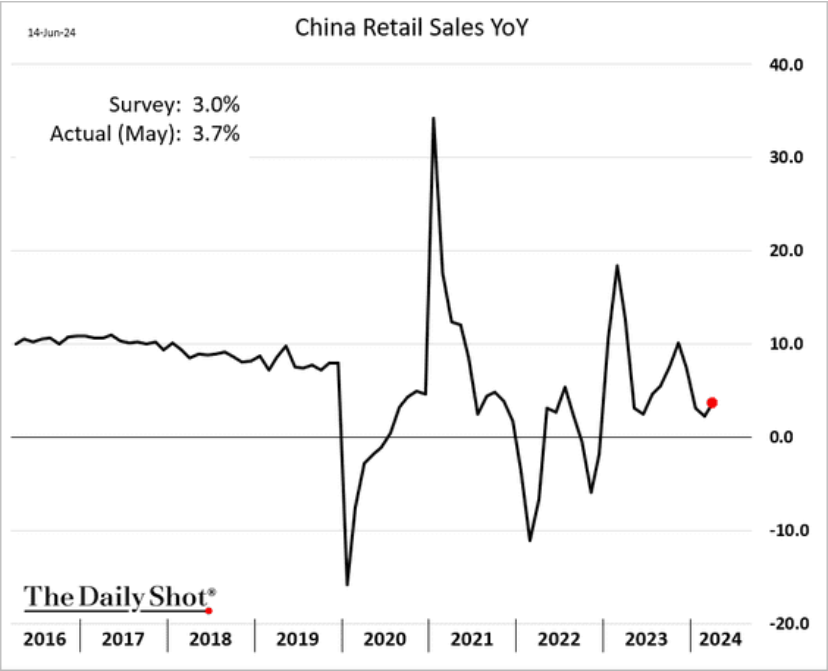
Retail Sales:
(Click on image to enlarge)
What 2H will look like (earnings broaden = rally broaden):
(Click on image to enlarge)
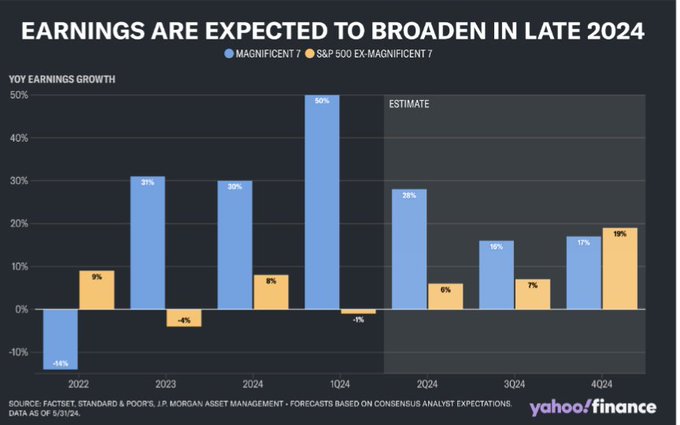
Source: Yahoo! Finance
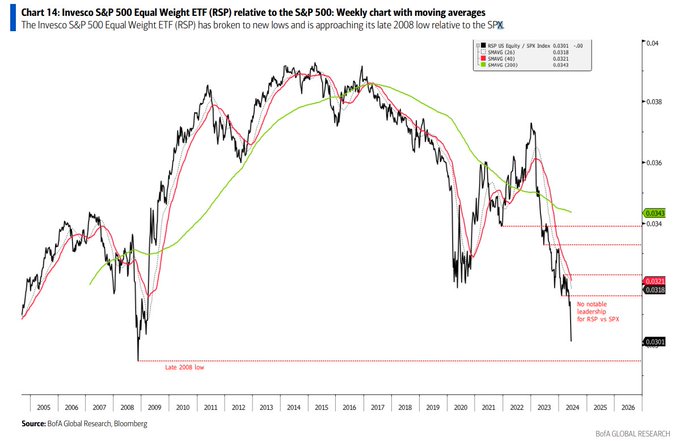
Some Market Observations
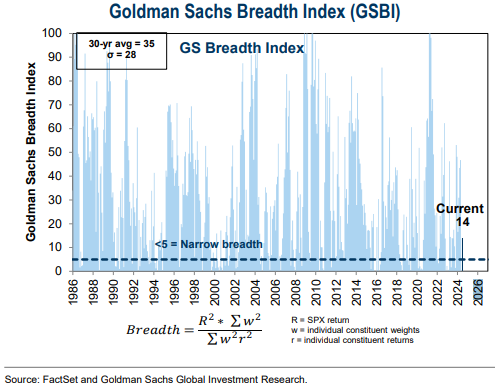
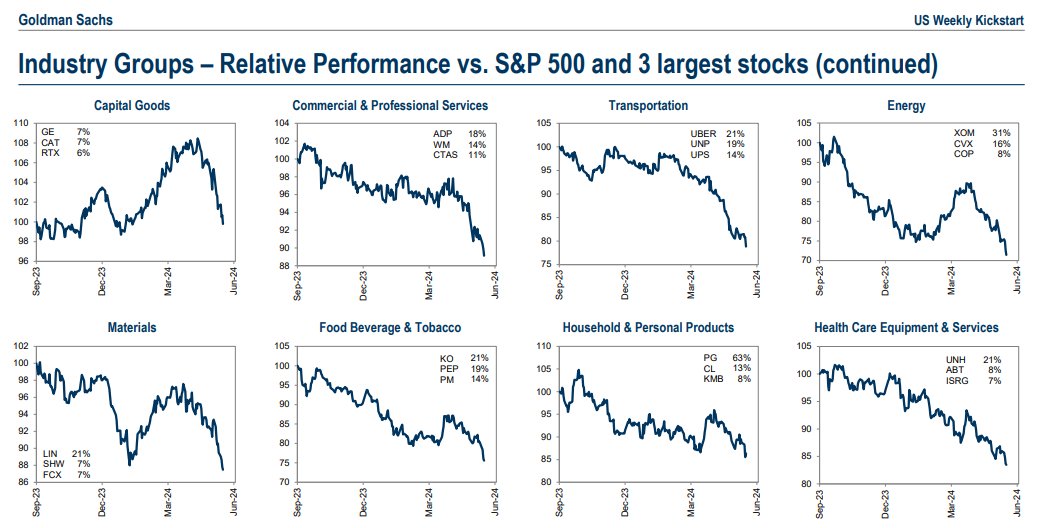
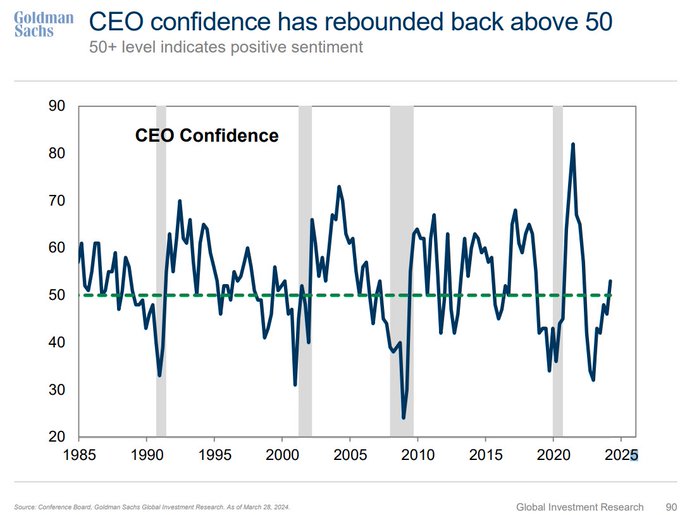
As I stated in my two appearances above, we are on the cusp of a “broad participation explosion” where the “shiny object” leaders begin to underperform – while the laggard remaining ~90%+ of the market can begin to outperform. All that means in English is that the general indices may begin to flatten out – more modest net growth into year end because the “heaviest weightings” begin to slow, while the “lower weighted” issues begin to take off.
(Click on image to enlarge)
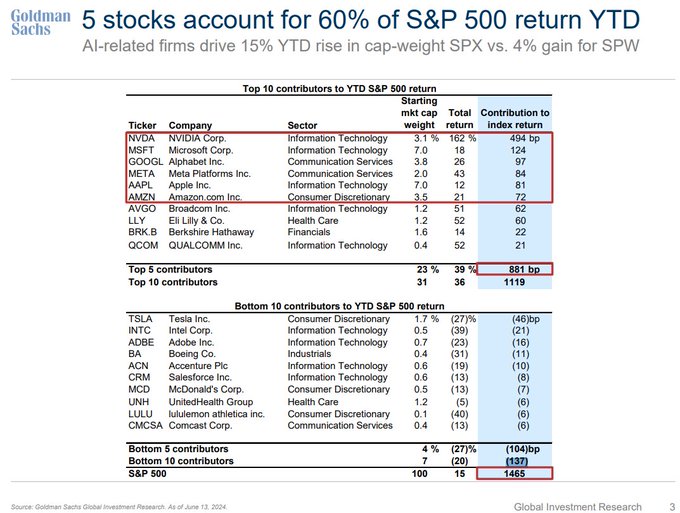
Source: Goldman Sachs
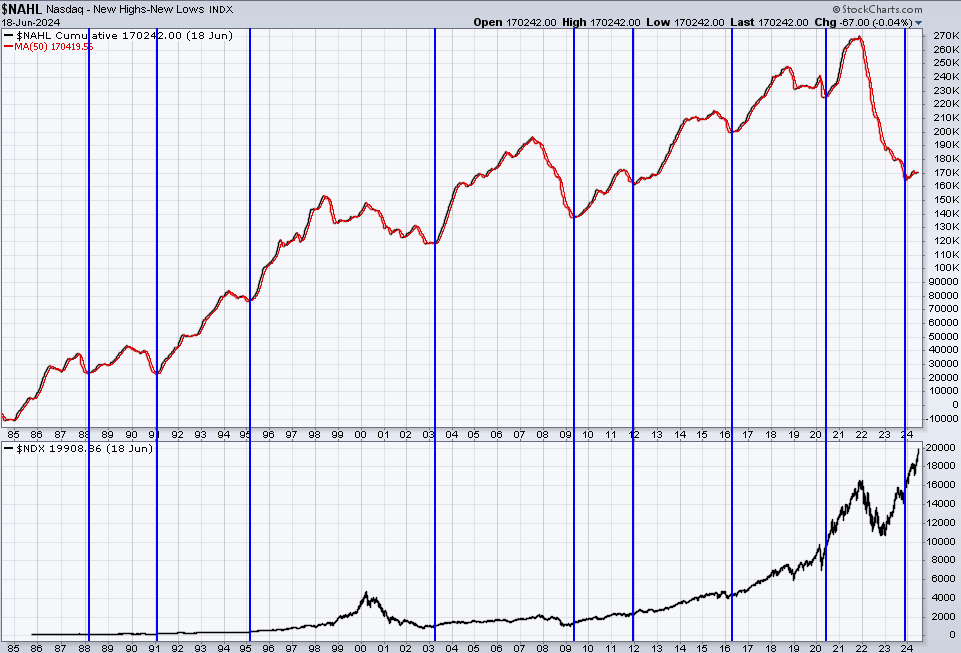
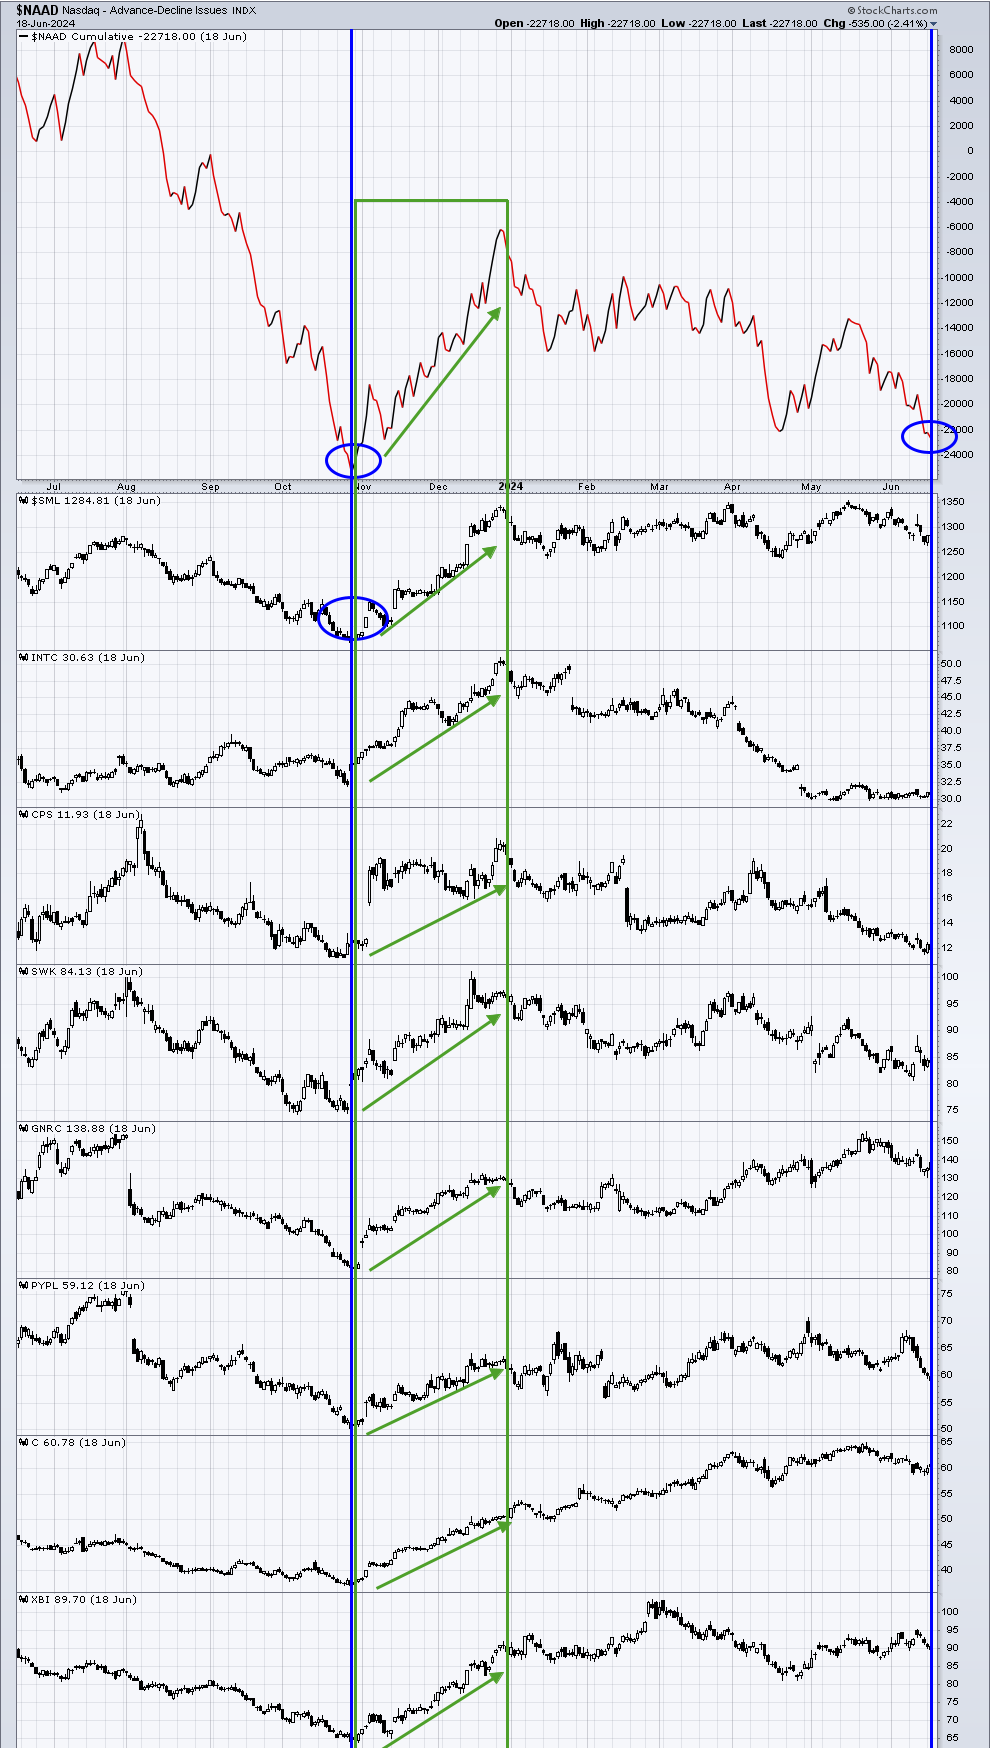
Looking at this New Highs – New Lows index for the Nasdaq we can see just how pronounced the effect of a few stocks has been on the general index – due to their weightings. Drops like this have been coincident with LOWS in the index, not new highs. Meaning, the vast majority of stocks are trading like the index is at lows, not highs.
(Click on image to enlarge)
(Click on image to enlarge)
(Click on image to enlarge)
(Click on image to enlarge)
(Click on image to enlarge)
If you remember we were in a similar situation in October 2023 until the switch flipped and the next 2 months was the greatest rally in the shortest period of time for laggards that we had seen in years. By Jan 1 we were smiling so wide we could eat a banana sideways. Notice the resemblance:
(Click on image to enlarge)
(Click on image to enlarge)
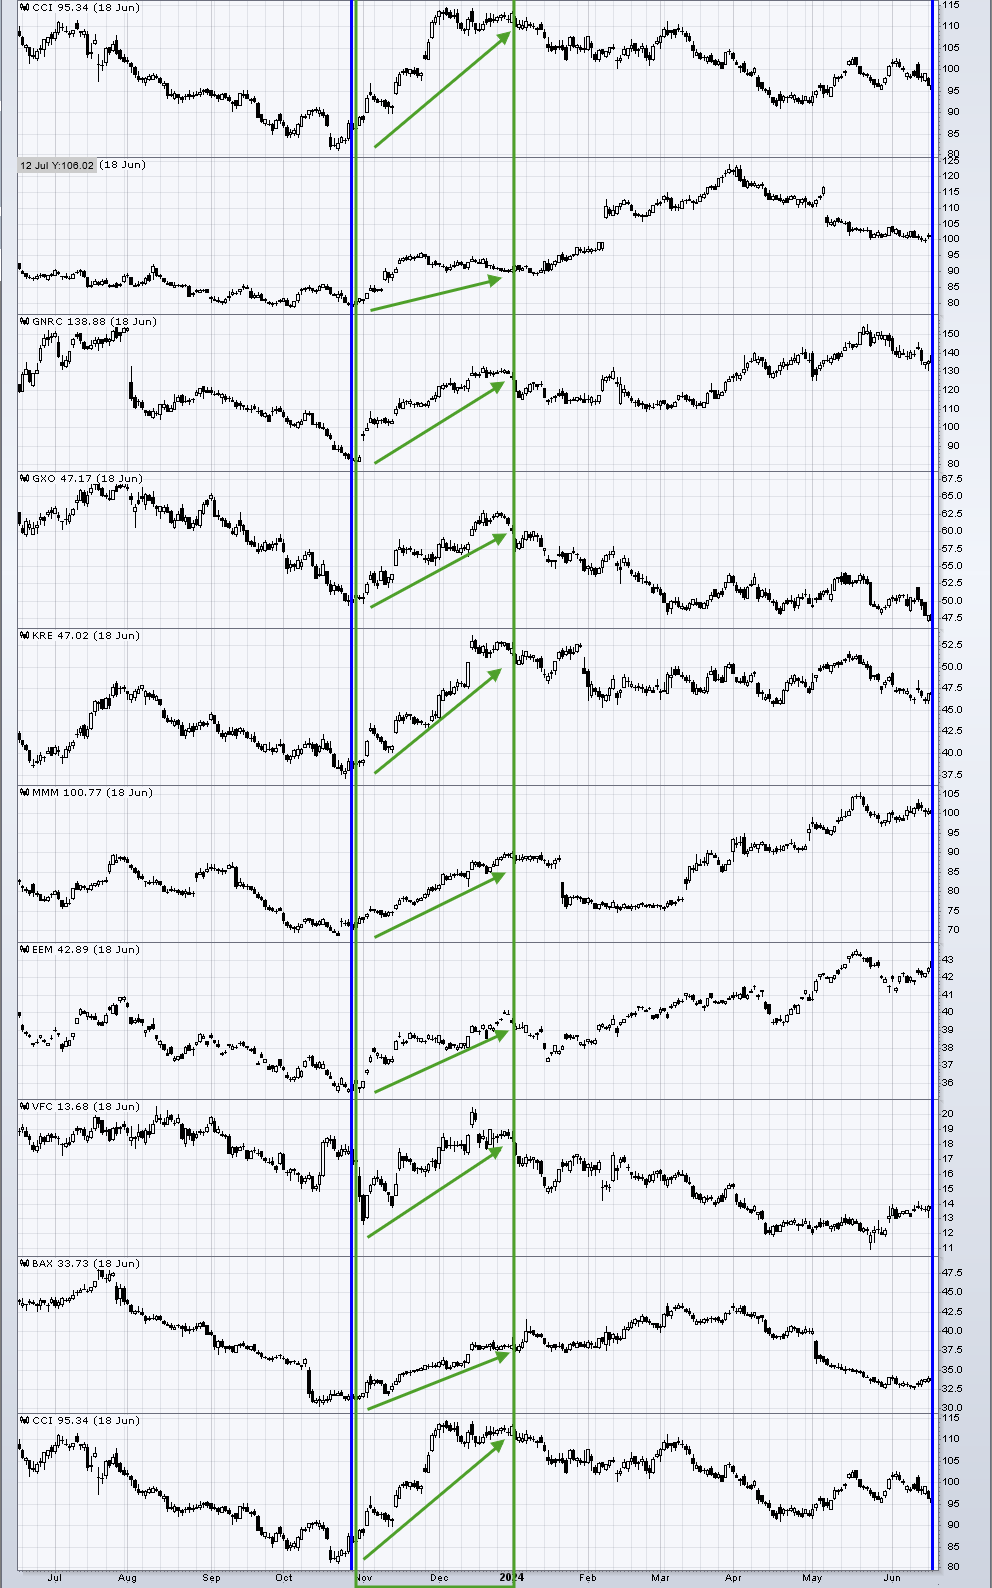
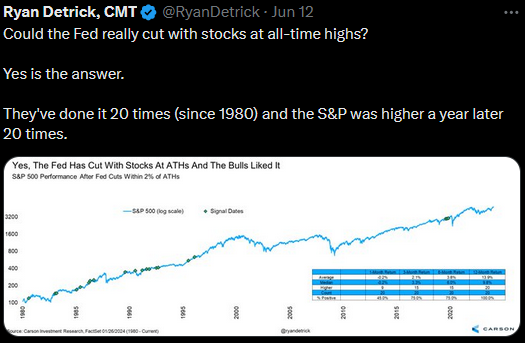
Same companies, same fundamentals. Difference? Structural shift based on perceived shift in Fed policy and the cost of capital moving forward (i.e. a Fed removing some restriction will yield a soft landing and capital markets open for refinancing for companies with debt). In my appearances above I laid out the case on why the Fed will move before year-end and the impact of the Fed buying $35B/mo in Treasuries that resumed on June 1, 2024. Do I expect any miracles before the end of Q2? No. However, the shift should begin very soon once again. We are at a meaningful extreme. NVDA should rest, everything else can rip!
(Click on image to enlarge)
Tech Wreck Part Deux?
(Click on image to enlarge)
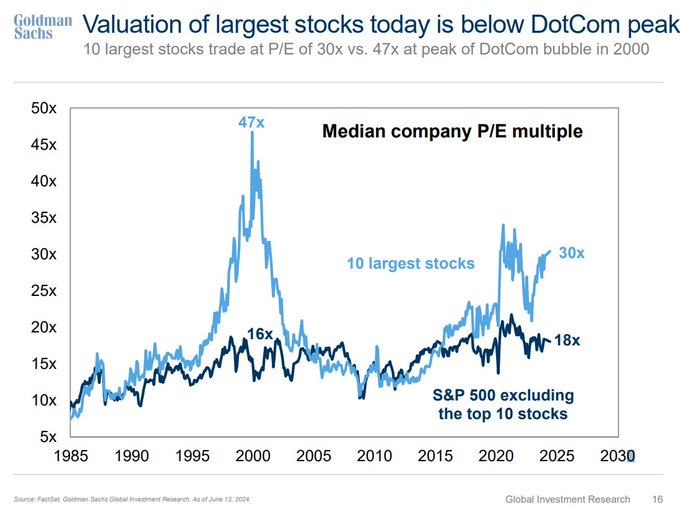
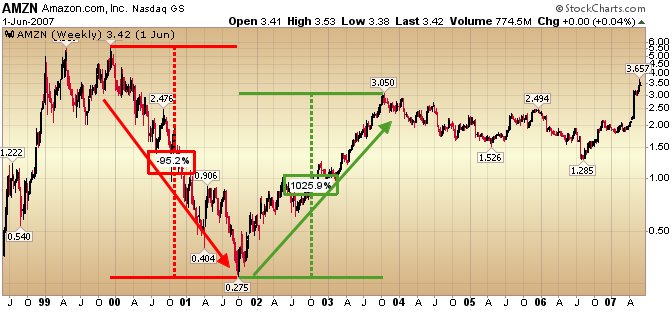
For everyone comparing the current market to the 2000 tech wreck, you are blinded by recency bias. It will not repeat in the exact same way – or even potentially at all. Each new downturn has a new flavor. However, the 2000 Nasdaq tech wreck DID in fact repeat two years ago in China. Here’s how it looked:
Over 2 years from late 1999 to late 2001, the “Alibaba” of the US (top e-commerce company and would-be cloud provider Amazon.com) fell ~95% in stock price despite the underlying fundamentals improving (under the surface). Over the next 2 years (from late 2001 to late 2003), the stock recovered most of its losses. It’s gone on to be a ~60x bagger since the 2003 recovery.
Listen to what Jeff Bezos had to say about this period (which is similar to what is happening at Alibaba right now):
(Click on image to enlarge)
Over 2 years from late 2021 to late 2023, the “Amazon” of China (top e-commerce company and cloud provider Alibaba) fell ~83% in stock price despite the underlying fundamentals improving (under the surface). Over the next few years, we’ll see how it can recover.
(Click on image to enlarge)
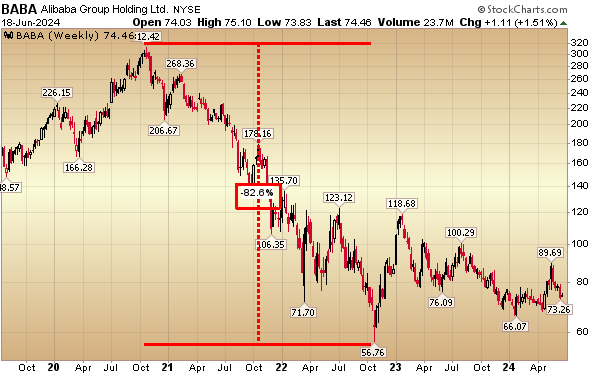
Will the first 1-2 cuts cause a “catch up” play in Emerging Markets/China in the 2H of this year? Time will tell, but the underlying fundamentals continue to improve.
(Click on image to enlarge)
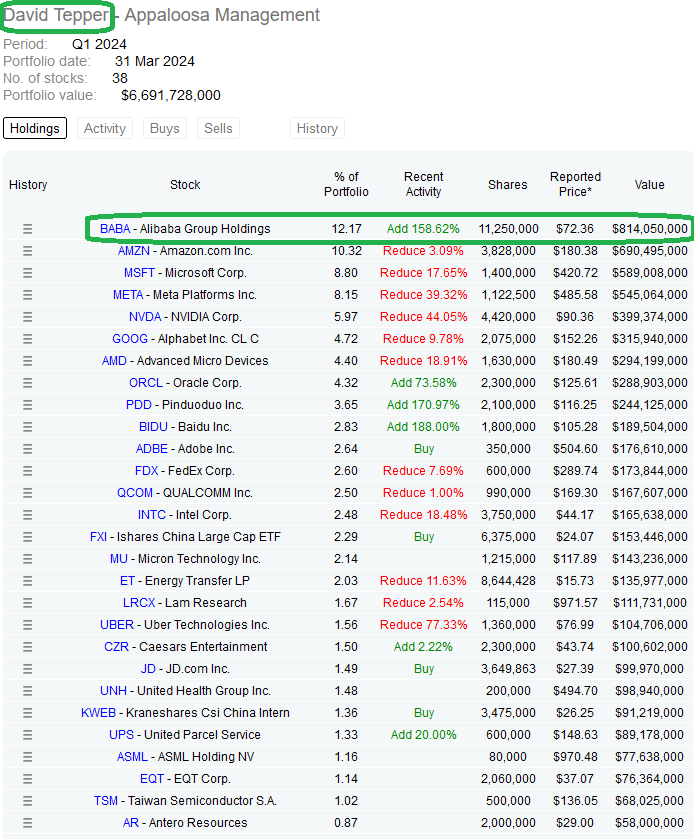
David Tepper may struggle a bit picking football players, but when it comes to picking stocks and turnaround situations, few are better.
(Click on image to enlarge)
Bank of America Fund Manager Survey Update
On Tuesday, we put out a summary of the monthly Bank of America “Global Fund Manager Survey.” This month they surveyed 206 managers with $640B AUM:
Here were the key points:
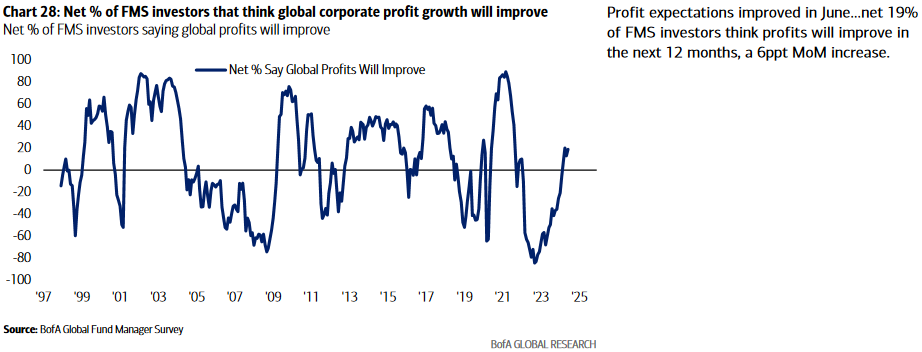
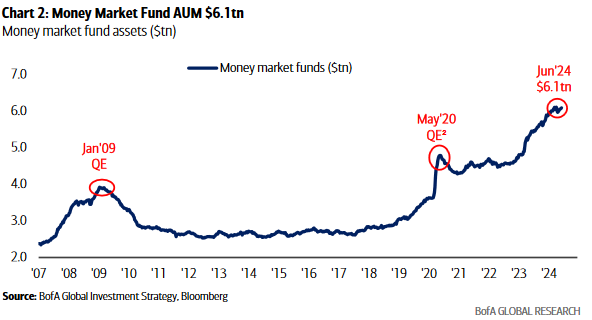
1. Recoveries in corporate profit growth expectations (off depressed levels) precede multi-year recoveries 2020, 2009, 2001:
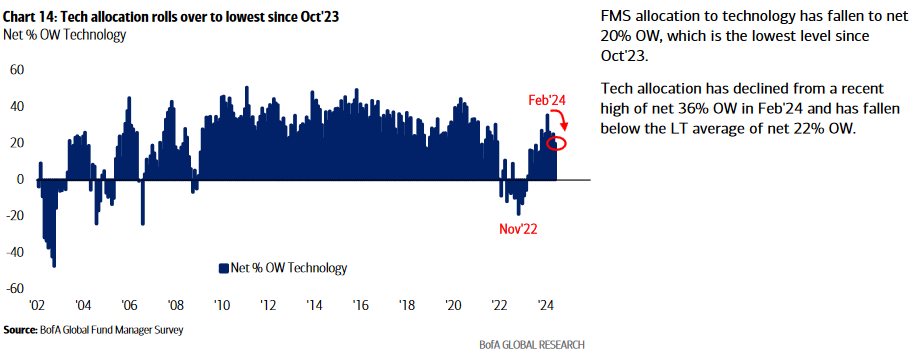
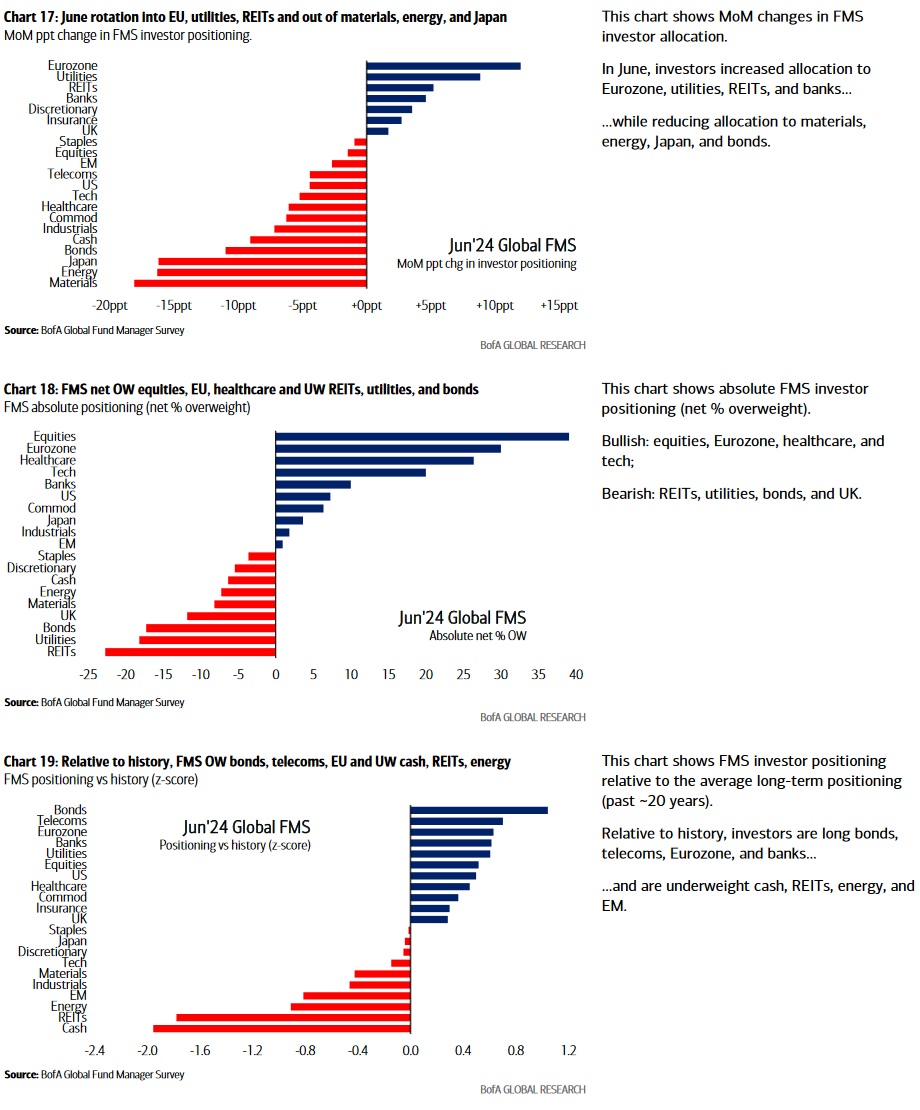
2. Overweight tech crowding starting to weaken (minus a couple of select issues):
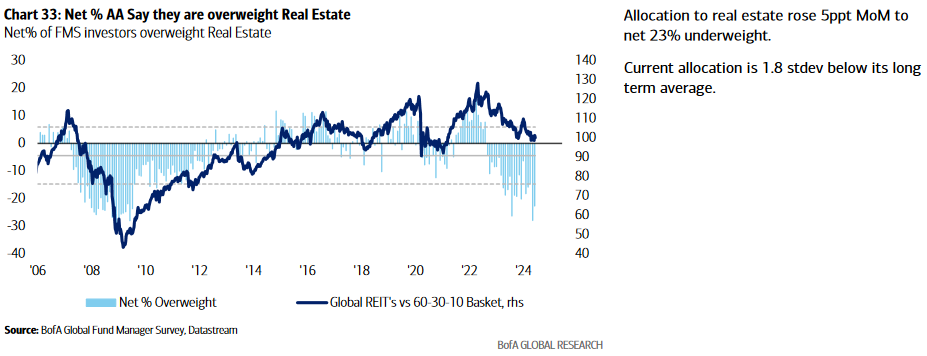
3. REITs starting to get a little love but dramatically underweight relative to history:
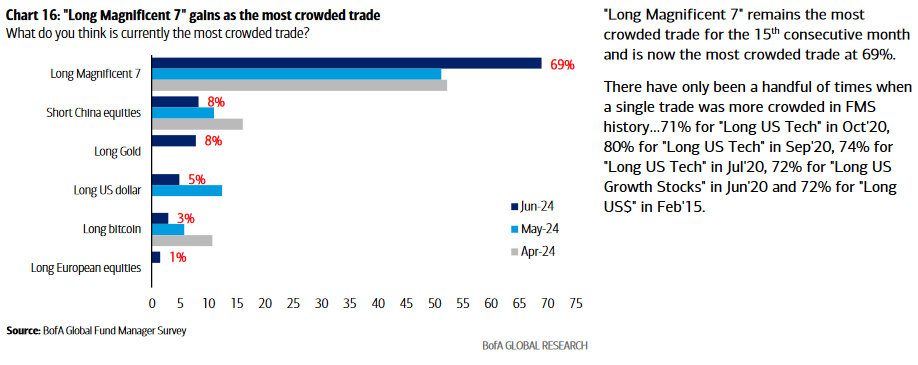
4. Waiting for the whipsaw reversal in the 2 most crowded trades (Long Mag 7, Short China):
In short, if you enjoyed the last few months of 2023 and early 2024, what’s ahead will make those gains look like child’s play. Those with money to work in the right places now are going to benefit from the residual effect of an opportunity created by a once in 100 year event (destock/restock cycle created by covid). It’s just beginning…
Now onto the shorter term view for the General Market:
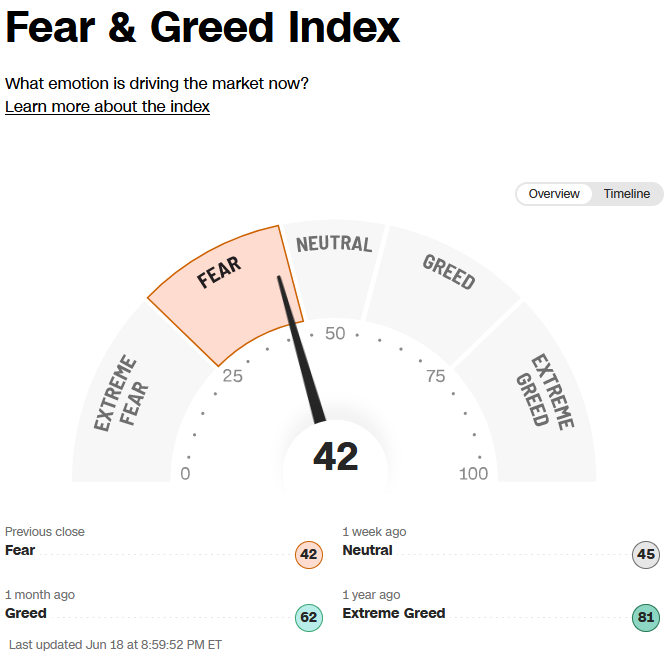
The CNN “Fear and Greed” moved down from 46 last week to 42 this week. You can learn how this indicator is calculated and how it works here: (Video Explanation)

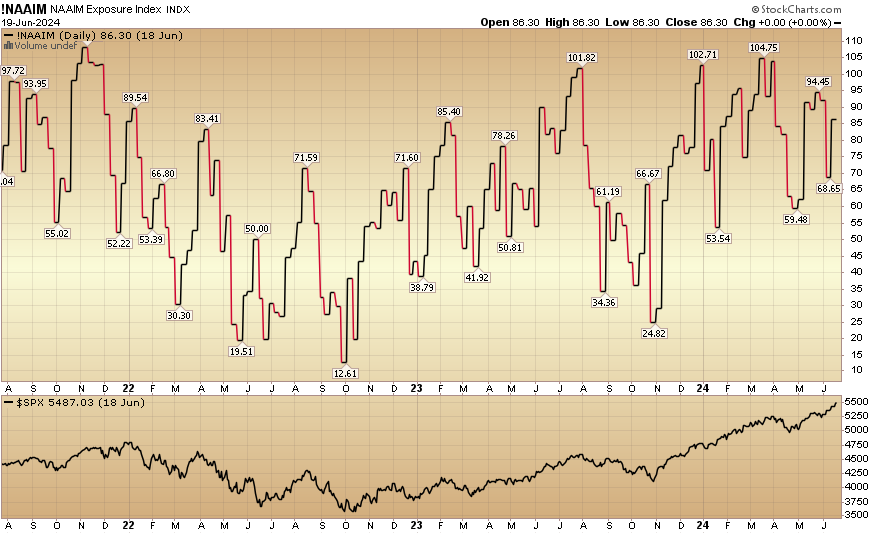
The NAAIM (National Association of Active Investment Managers Index) (Video Explanation) rose to 86.30% this week from 68.65% equity exposure last week.
Our podcast|videocast will be out tonight. Each week, we have a segment called “Ask Me Anything (AMA)” where we answer questions sent in by our audience. If you have a question for this week’s episode, please send it in at the contact form here.
Congratulations to all of the new clients who came in so far this year during our Q1 and Q2 openings. We are now closed to smaller accounts ($1M+) again as of early this quarter and will remain closed to smaller accounts until sometime in Q3. Larger accounts $5-10M+ can access bespoke service at their preference here.
*Opinion, Not Advice. See Terms
Not a solicitation.
More By This Author:
What I’m Thinking About Now – Stock Market (And Sentiment Results)…
Trucks And Towers Stock Market (And Sentiment Results)…
Should I Be Worried? Stock Market (And Sentiment Results)…

Comments
Log in or sign up to join the conversation.