

Image Source: Unsplash
Yesterday I joined Neil Cavuto on “Cavuto Coast to Coast” – Fox Business. Thanks to Neil and Jenna DeThomasis for having me on. In this segment we discussed Markets, the Fed, the American Consumer, Inflation and a lot more. You can watch here:
Video Length: 00:03:18
The beauty and fun of live TV is that you have to be flexible. Here are the show notes I sent ahead of time:
We will discuss them in greater depth on the podcast|videocast tonight.
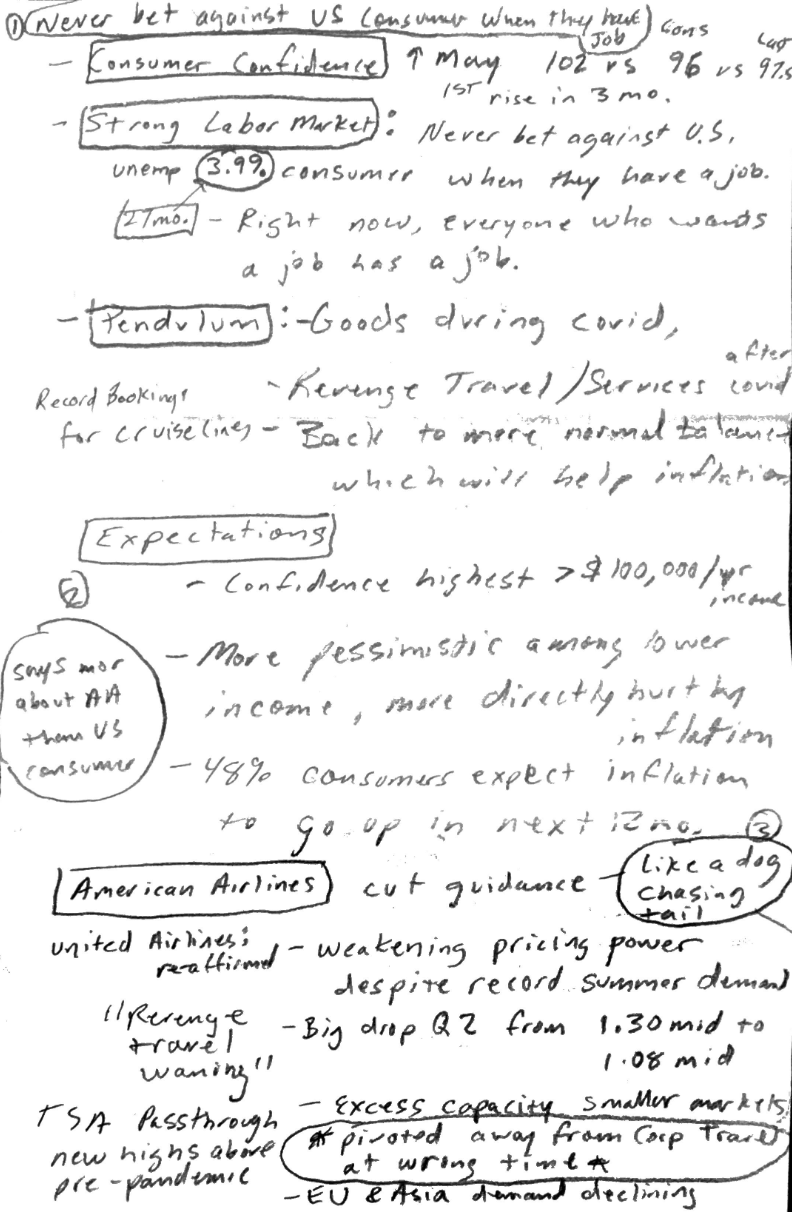
Due to American Airlines earnings/guidance and the impact of the political trial, we shifted gears a couple of hours before the show – so I scribbled down a few notes ahead of time and walked over to the station:

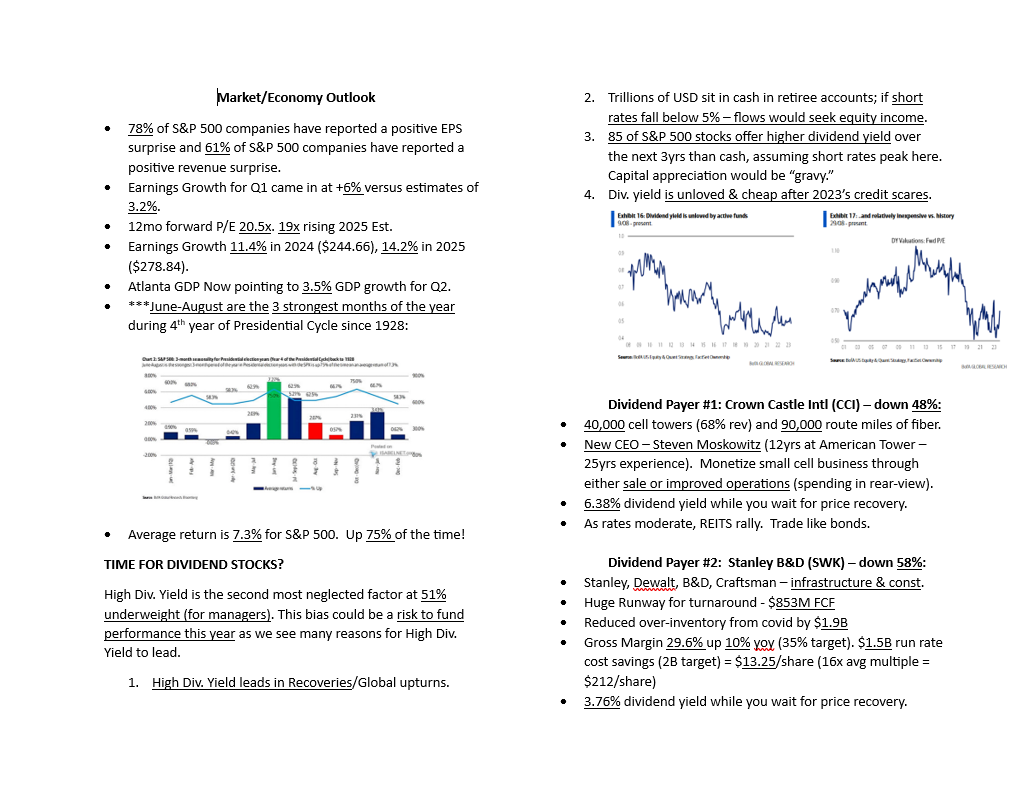
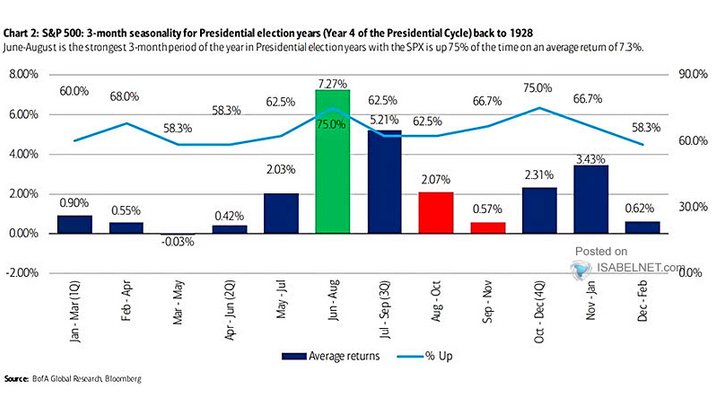
Seasonality/Outlook
One of the key points we covered in a recent podcast|videocast was a chart put out by Bank of America that measured the realized returns from June-Aug in the 4th year of an election cycle (like we are in right now). Since 1928, the average return was ~7.3% with 75% of the instances positive:
You can bet against the odds because of a few days of volatility, or you can burden yourself with the facts from my notes above:
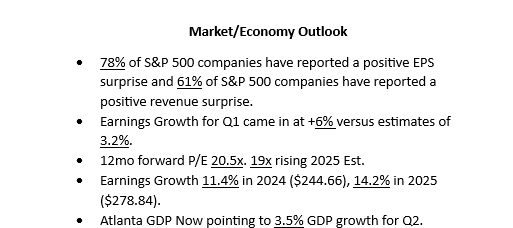
Multiples may seem high, but when you compare them to earnings growth, they begin to make more sense. Think of it as you would a “PEG” (price to earnings GROWTH) ratio on an individual stock. People don’t mind paying 30x earnings for a stock growing earnings at 20% (1.5 PEG ratio), but 30x would be very high for a company growing earnings at a more modest 6% (5.0 PEG ratio).
If you ZOOM OUT, while the 19x 2025 EPS multiple SEEMS high because the 10 year average PE was 17.6x, you have to put it in context. S&P 500 earnings growth historically averages high single digits. For example, from 2000 to 2024, S&P 500 EPS has grown from ~$56 to ~$244 expected for 2024:
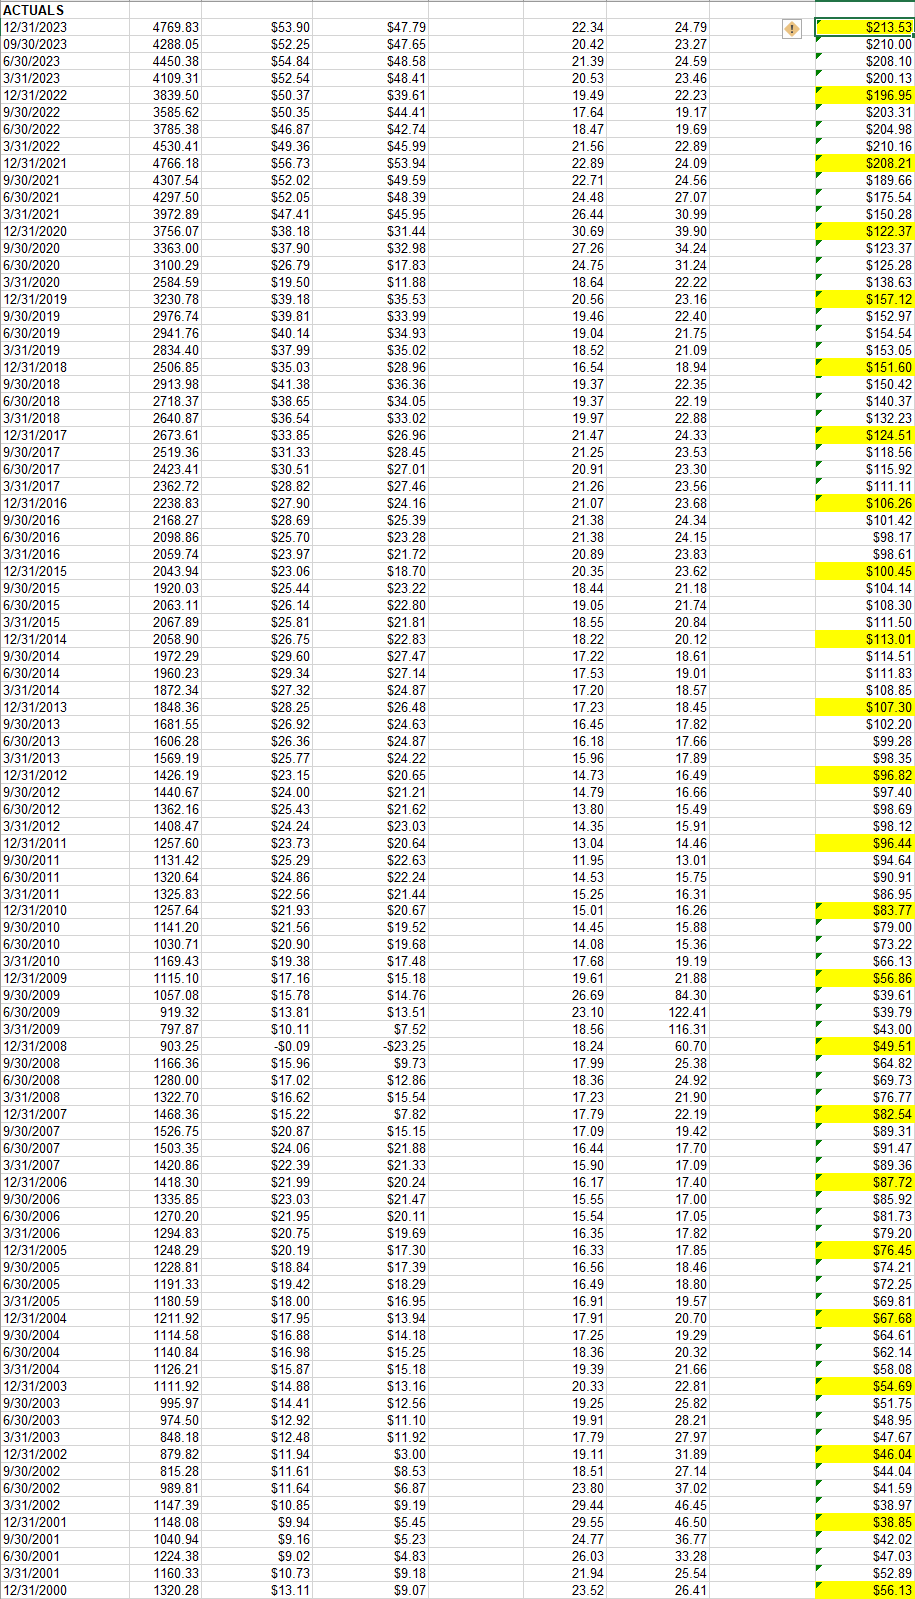
Data Source: Howard Silverblatt S&P Global
So if the average multiple was 17.6 on 6.32% earnings growth, you had a PEG (price to earnings growth ratio) of 2.78 (considered expensive).
However, now we are trading around 19x 2025 estimates – which implies 14.2% earnings growth. While the “p/e multiple” (19x) is a little higher than the 10yr average of 17.6x, the EARNINGS GROWTH RATE IS MORE THAN DOUBLE! So the PEG is 1.34. This is considered on the cheaper side as it relates to PEG ratios. Peter Lynch became famous for using this ratio to find individual stocks, but I have never seen anyone talk about it in detail as it relates to general indices.
If you applied the historic PEG of 2.78x to 2025 earnings growth of 14.2% you would get a P/E multiple of 39.47x. If you applied the historic PEG to 2024 earnings growth of 11.4% you would have a p/e multiple of 31.69x. Take the mean of those two for 35.58x 2025 estimates of $278.84 earnings and you get to an S&P 500 at 9,921!!!
Do we expect anything like that? Hell no, but it puts things in perspective when people say “multiples are too high” but they do not take the time to ask the question, “relative to what?” In other words, a 5x p/e ratio can be too expensive if you are only going to grow earnings at 1% per year, just as a 40x p/e multiple can be too cheap if you’re going to grow earnings at 50% per year.
Does this mean we are pounding the table to buy the S&P 500 index hand over fist? Again, hell no.
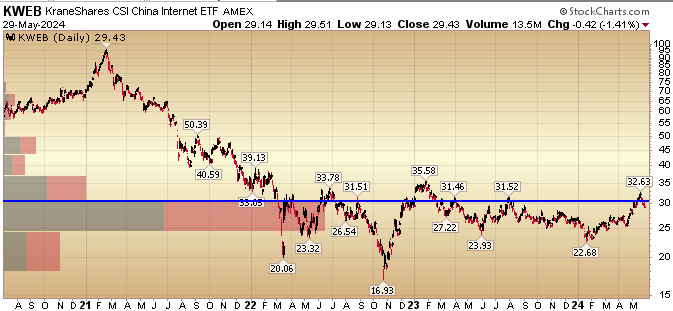
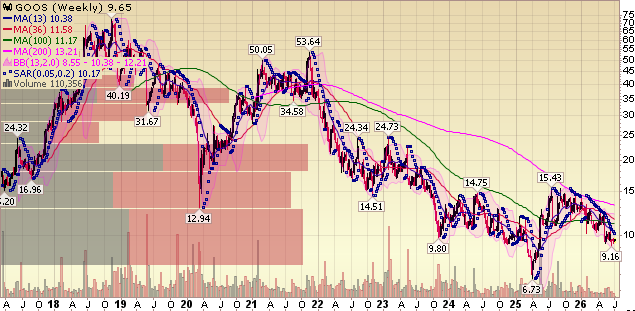
BUT, it DOES MEAN we are aggressively putting money to work in individual companies that are excessively undervalued relative to what we believe their normalized earnings power will look like as their recoveries progress/continue. For instance, Alibaba will return to double digit earnings growth while trading at a single digit p/e currently. We have about a dozen or so of these diamonds in the polishing machine.
Some are already shining up 50 and 100%+ (CPS, AMZN, GOOGL, SMTC, SE, GNRC, Rolls Royce, RRC, etc) and a lot more room to run. Others are still in the polishing machine getting buffed and will come out as multi-baggers over time. We have discussed several on our podcast|videocast(s) and the rest are known by our clients when they look at their portfolios.
Charts I’m Paying Attention To
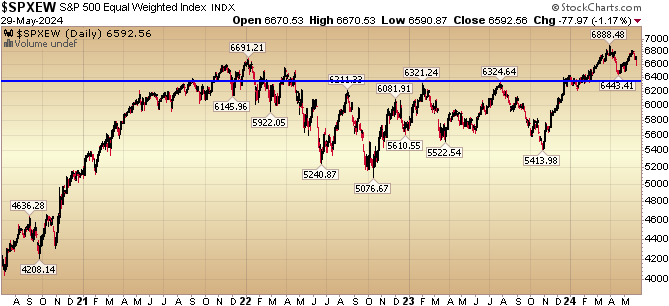
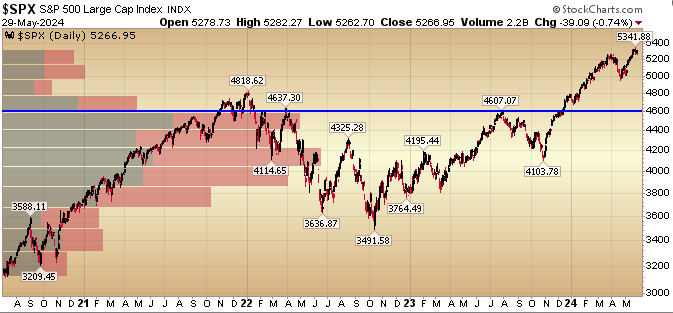
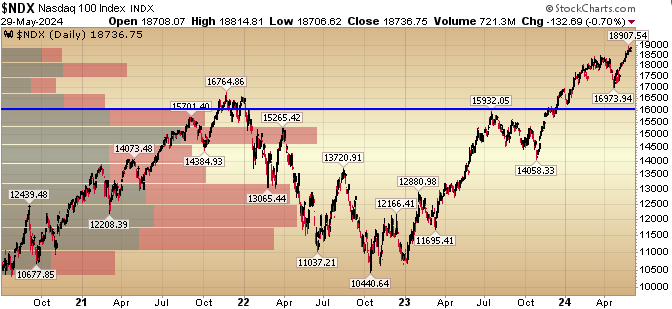
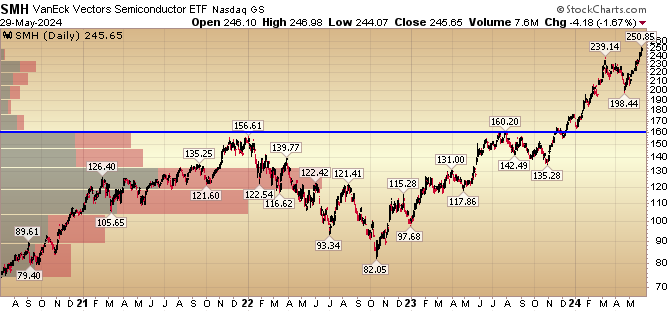
Now onto the shorter term view for the General Market:
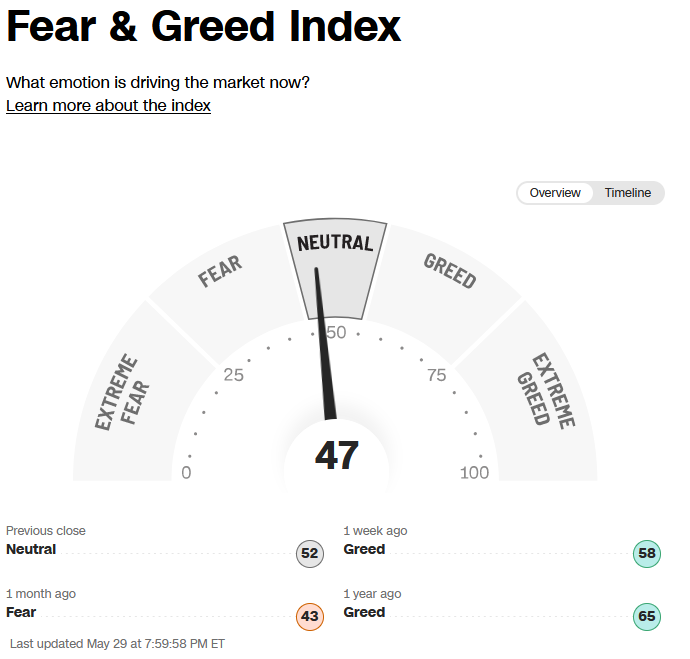
The CNN “Fear and Greed” fell from 59 last week to 47 this week. You can learn how this indicator is calculated and how it works here: (Video Explanation)
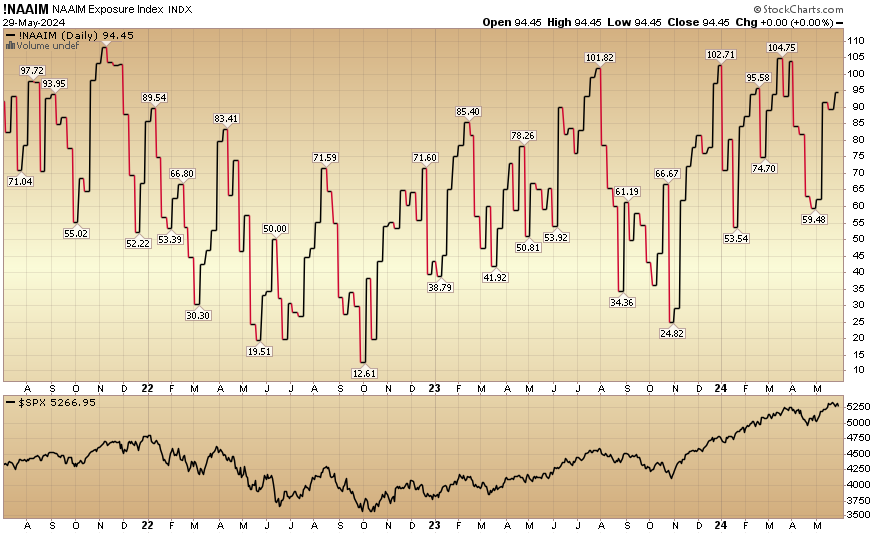
The NAAIM (National Association of Active Investment Managers Index) (Video Explanation) rose to 94.45 this week from 89.25% equity exposure last week.
More By This Author:
BABA Bad Or BABA Beautiful? Stock Market (And Sentiment Results)
Are You Mad Or Glad? Stock Market (And Sentiment Results)
Powell’s, “Let There Be Light” Stock Market (And Sentiment Results)


Comments
Log in or sign up to join the conversation.