
Overview
Analysts and investors have long puzzled over the difficulties of calculating the cost of equity. The cost of equity is an essential component of the cost of capital, and the cost of capital is essential if we want to know the present value of an investment.
In this article, I will propose a solution to these difficulties.
The article is arranged into the following discussions.
- The problems with the conventional measure of the cost of equity.
- The concept of the discount rate and the three intuitive concepts behind the cost of equity.
- How those three intuitive concepts interact.
- The cost of debt. This is not terribly hard to compute and can give us a feel for what we should expect in calculating the cost of equity.
- The accounting cost of equity: the actual dollar costs involved in issuing and buying back shares and in paying out dividends.
- Myron Gordon and the expected cost of equity, which is a solid accounting measure of equity costs based on a dividend discount model. Basically, the cost of equity equals yield plus growth.
- The Capital Asset Pricing Model (CAPM) cost of equity. This is an extremely problematic measure. Although it is very widely used, I think it should be killed, and I’ll explain why.
- The solution to the cost-of-equity conundrum.
- A step-by-step method to calculate the cost of equity.
- A breakdown of the cost of equity by industry group.
- Using my formula for the cost of equity to calculate a company’s intrinsic value.
- A conclusion that discusses how I approached the problem and how I solved it.
Part One: The Conundrum in a Nutshell
One of the principles of finance is that the net present value of an investment is its future value divided by one plus a discount rate. Why? Because $1,000 now is worth more to almost anyone than $1,000 a year from now.
The discount rate can be viewed as subjective, dependent on the investors’ personality; but that’s not a very practical way to view it. It makes more sense to view it as the interest rate the investor expects from a close alternative to the investment in question. So the logical answer to “how much am I willing to pay for $1,000 a year from now” is not simply $900. It depends on whether or not I think I can safely get 11.11% on my $900 if I invest it in something else. If I think I can get 40% on my $900, I certainly wouldn’t be willing to pay $900 for $1,000 a year from now. But if I think I can only get 3%, then $900 now for $1,000 a year from now strikes me as a bargain. What if I think there’s a 10% chance I can get 40%, a 10% chance I’ll lose 50%, and an 80% chance I’ll get 5%? We weight the percentages and come up with a weighted average of 3%; therefore I should be willing to pay up to $970.87 ($1,000/1.03).
This is why we talk about a close alternative, a comparable investment.
The $1,000 offered a year from now is a sure thing, and is very much like a one-year treasury bond. A stock, however, is a totally different ball of wax. What should be the discount rate for an investment that might be worth double a year from now — or half?
And here’s where we run into problems.
Let’s look at the 5,000 most liquid stocks that are tradeable in the US. (I’m using as my measure of liquidity the median daily dollar volume over the last nine months). Since 1999, the compound annual growth rate of those stocks, with yearly rebalancing and with no survivorship bias, has been 10.89%.
This, to me, seems to be a good starting point for the cost of equity if you’re looking to calculate the intrinsic value of a stock. (The cost of equity is the discount rate applied to the equity portion of a company’s capital. The discount rate applied to the entire company is the weighted average cost of capital, or WACC, which combines the cost of debt with the cost of equity depending on how much debt and equity a company has.)
However, every book on finance will tell you that different stocks should have different costs of equity. A very risky stock — and there are any number of ways to think about risk — should have a cost of equity that’s significantly higher than a relatively risk-free stock.
This certainly applies to bond yields, as it should. Rating companies give bonds ratings according to their default risk, and this helps determine their yields.
However, there are no ratings agencies out there determining the risk of a company’s stock. And it turns out that risky stocks do not necessarily have expected returns higher than safe stocks.
The cost of equity is conventionally calculated by taking a stock’s beta, multiplying it by an equity risk premium, and then adding that to the risk-free rate. But that doesn’t actually work in real life.
For one thing, if you look at historical returns, there’s no positive relationship between the risk-free rate (commonly the ten-year treasury yield) and the actual returns of the stock market. The difference — the supposed equity risk premium—has a higher standard deviation than the actual return (i.e. it fluctuates more). The correlation between the one-year return of the stock market and the ten-year treasury yield at the beginning of that one-year period is actually –0.20, which means that when treasury yields are high, stock returns are low, and vice-versa. So the whole idea of an equity risk premium is badly flawed.
For another, stocks with high beta do not tend to have higher returns than stocks with low beta. There have been countless studies for close to forty years confirming this in a variety of markets. If the expected return of a low-beta company should logically be equal to or greater than that of a high-beta company, that turns the conventional model on its head.
In general, investors should not assign a higher discount rate to riskier stocks if the discount rate corresponds to expected returns. As Charles Lee and Eric So wrote in their book Alphanomics, “healthier and safer firms, as measured by various measures of risk or fundamentals, often earn higher subsequent returns. Firms with lower beta, lower volatility, lower distress risk, lower leverage, and superior measures of profitability and growth, all earn higher returns.”
The idea that investors are compensated for risk with higher returns makes no sense if you apply it to the stock market. Yes, stock investors are compensated for risk when choosing between stocks and bonds. But not when choosing among different stocks.
What, then, should you use as your cost of equity when calculating a stock’s intrinsic value?
Part Two: The Discount Rate and the Three Costs of Capital
We call the discount rate, which can be viewed as the compensation for an investor’s appetite for risk or the fulfillment of an investor’s expectation of excess returns, “the cost of capital.”
But why? What does the discount rate an investor applies actually have to do with a manager’s cost of capital?
If you study financial theory, you’ll learn that each company has a “required rate of return” or “discount rate” or “cost of capital.” This number is:
-
the return that investors expect in order to invest in the company (the opportunity cost or expected return),
-
the percentage of the company’s capital that the company is expected to spend raising that capital (the historical or accounting cost), and
- the amount to discount future cash flows (or dividend payments) from that company in order to arrive at the present value of those cash flows (or dividend payments).
Financial theory holds that all three of these numbers are essentially the same.
The cost of capital is composed of the cost of equity and the cost of debt, weighted in proportion to the market value of equity and debt. The cost of debt is relatively simple to calculate. Let’s look at the above three definitions as they apply to the cost of debt:
- is the return that the bank expects when they make the loan, or the bondholders expect when they buy the bonds.
- is the interest that the company is going to pay the bank and the bondholders.
- is the discount rate to arrive at future cash flows that the debt is going to pay for.
Clearly, all three of these are going to be either the same or very close.
But when it comes to the cost of equity, the equivalence is not as intuitive. I’m going to take a close look at all three of these numbers, discuss their similarities and differences, demonstrate various ways of calculating them, and settle on a seventy-year-old method that appears to me better than the one that’s currently in vogue.
Part Three: The Relationship of the Three Costs of Capital
I’m going to be turning frequently in this discussion to an excellent book, Mihir A. Desai’s How Finance Works. As a concise explanation of the conventional wisdom about finance, it’s unequalled in its readability and reasonableness.
Desai explains,
As stewards of the capital entrusted to them by equity and debt holders, managers must consider the cost of that capital, even if that cost is not explicit. In effect, the returns demanded by capital providers become the costs of capital for managers. . . . Managers apply discount rates to penalize future cash flows . . . because there is an opportunity cost to any investment. Those discount rates are often referred to as costs of capital because they refer to the penalties (costs) associated with deploying that capital. . . .
I would like to add here that the historical costs of equity can be quantified and may be only tangentially related to opportunity costs. Managers do consider these costs in addition to opportunity costs.
Desai continues,
The key insight is that the costs of capital are a function of the returns that investors expect. In short, an investor’s expected return becomes the cost of capital for managers.
But when it comes to the cost of equity, how does this happen? And why should it? Opportunity costs and expected returns can be extremely amorphous.
To understand how this works in real life, let’s look at a hypothetical example. An analyst is called upon to come up with an intrinsic value for a small private company. This company obtains its capital through loans from banks and from private investors who own a portion of the company in return for their investment in it. The discount rate the analyst will apply will depend on the cost of debt and the cost of equity, weighted by the amount of capital contributed by the banks and the investors. The cost of debt is not difficult to ascertain: the analyst will talk to the bank and find out how much interest the bank will charge. The cost of equity, however, is more difficult. It should match the returns the investors expect, because if those returns aren’t high enough, the investors will simply not give the company any money. In other words, for each company there’s a hurdle rate for investors. How does the analyst find out that hurdle rate? She’ll talk to the investors, look at similar investments, look at the company’s sales pitch, and so on. She will probably not take into account any actual accounting costs of selling a portion of the company to the investors, since there are very few of those. The entirety of the cost of equity lies in the returns the investors expect.
It makes perfect sense, then, to look at opportunity costs and expected returns as the costs of equity for managers rather than looking at the actual accounting costs of equity issuance.
However, for public companies, those accounting costs are real, and they do have some relationship to expected returns, as I will explain shortly.
Part Four: The Cost of Debt
For most public companies (with the exception of banks and insurance companies), the cost of capital has two components: the cost of debt and the cost of equity.
The actual cost of debt is relatively easy to calculate: you take the interest paid, multiply it by one minus the effective tax rate, and divide by the total debt.
We assume that the cost of debt is the same for investors and for the company’s own managers. So I chose twenty US companies with bond ratings at random and calculated their cost of debt. (I used five-year averages for the interest expense and debt and a five-year median for the effective tax rate, and relied on Portfolio123 for screening the stocks, using Compustat data.) I then looked up their bond rating from Moody’s. The results are as follows, sorted by bond rating from best to worst:
You’ll see that as the rating goes from Aa1 to B3, the cost of debt generally rises. And lower-rated bonds pay significantly higher yields. Here’s the curve:
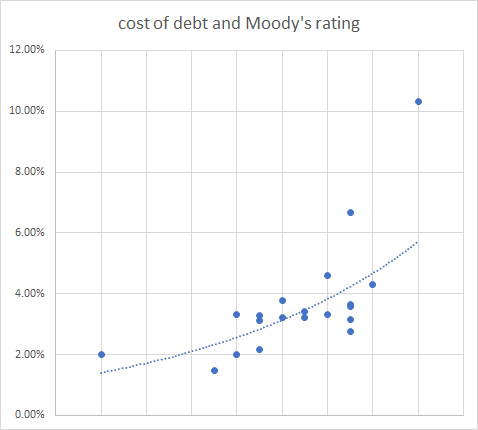
So, if you compare one company to another, the cost of debt goes up when the company’s bond yields go up, thus fulfilling the classical assumption to some degree. Large differences remain, however.
What about in time? What happens to the cost of debt for managers when bond yields go up or down? And what happens to bond yields when the cost of debt for companies goes up or down?
One would expect that the changes should be parallel. However:
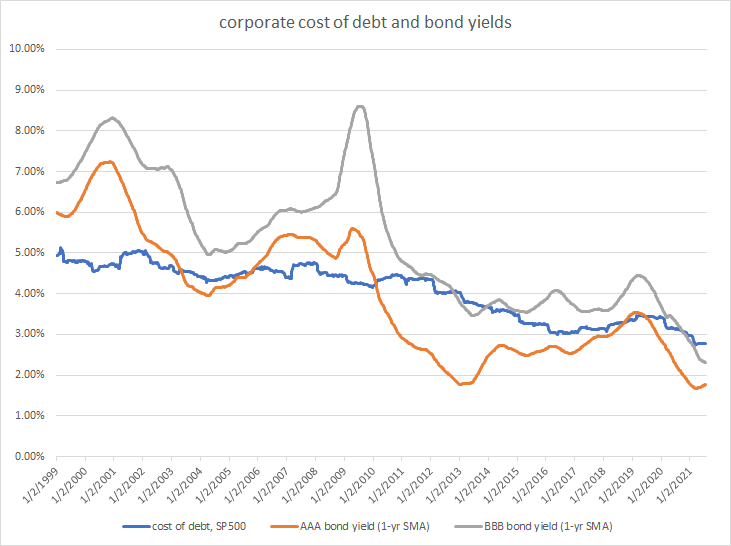
As you can see, the cost of debt for managers has remained pretty steady over the last twenty years, declining gradually from 5% to 3%. Bond yields, however, have varied a huge amount. Their general direction is the same, but the actual percentages are quite different. (To measure the cost of debt I took all S&P 500 stocks with interest expense and debt on their books and averaged their one-year cost—their after-tax interest expense divided by their debt. For the bond yields I used the one-year simple moving average of the daily yields for both AAA and BBB bonds.)
So the cost of debt, as we can see, is very roughly equivalent for investors and for managers, but there are substantial differences.
The cost of equity, however, is a totally different ball of wax.
Part Five: The Accounting Cost of Equity
For managers, the actual accounting cost of equity is the sum of the following costs:
- the cost of issuing and buying back shares
- the dividends paid to shareholders
- accounting and legal costs (including salaries) involved in running a public (as opposed to a private) company
Let’s break these down a bit.
- The Cost of Issuing and Buying Back Shares. The total cost of an IPO tends to be about 7% to 10% of the amount of the funds being raised, according to KPMG, but can vary widely. The cost of a secondary offering will be the sum of the cost of registration fees, underwriter commissions, legal and accounting fees, printing costs, clerical costs, and promotional costs. In addition, the effect of a share issuance on a company’s price can be substantial. A large increase in the supply of stock without a concomitant increase in demand can lower the stock’s price. Not only that, but a secondary offering often sends a message to investors that the company is desperate for cash, or that the amount of the company that they own is “diluted” (though, as Desai points out, that’s not technically the case, as the new shares increase the company’s equity in the exact same proportion as the “dilution”). So a secondary offering will sometimes result in a decrease in a company’s share price, which should be counted as part of the company’s cost of equity. The cost of buying back shares is much more straightforward. Perhaps a rough estimate, then, of the cost of issuing and buying back shares would be 8.5% of the IPO plus 10% of additional equity issued plus 100% of equity purchased.
- The Dividends Paid to Shareholders. This item is straightforward and easy to calculate.
- The Accounting and Legal Costs of Running a Public Company. These are not insignificant, and will include salaries for additional staff, in addition to compliance, registration, and listing costs; also, executive compensation is typically higher for public than for private companies. As a very rough estimate, I’ll use 20% of SG&A expenditures (excluding D&A and R&D expenditures).
If we aggregate all that and divide by the market value of equity, we get a graph that looks like this:

(This is the aggregate annual manager cost of equity for the S&P 1500, using Compustat data via Portfolio123.) We can see that the aggregate manager cost of equity varies from about 4% to 14%, and averages 6.08%.
But if we drill down to individual companies, their actual cost of capital can be negligible. Amazon (NASDAQ:AMZN), for example, pays no dividends, buys back no shares, issues no new shares, and has very low interest expense. If you use these figures to calculate its weighted average cost of capital, you come up with a rate of 0.65%. Even a relatively new company like Carvana (NYSE:CVNA) has a remarkably low cost of capital: it has paid an average of only $920,000 in dividends, spent an average of only $6.4 million on equity purchases, issued an average of $400 million in new shares, has typical SG&A expenditures of $500 million, and has paid an average of $46 million in interest expense. With a market cap approaching $28 billion and debt of $2.6 billion, its weighted average cost of capital is only 0.60%.
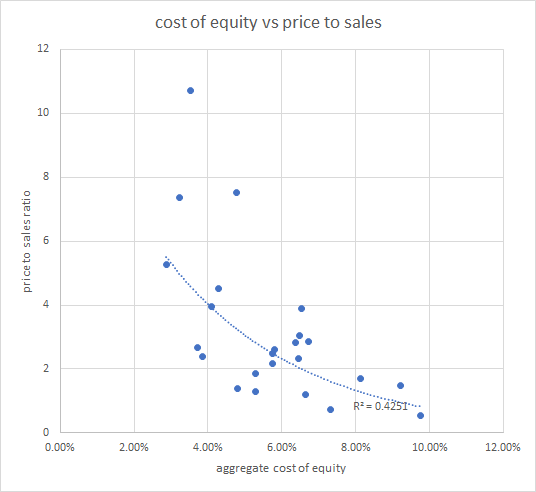
On the other hand, for companies with low price-to-sales ratios like Fossil Group (NASDAQ:FOSL), Tupperware Brands (NYSE:TUP), and Bed Bath & Beyond (NASDAQ:BBBY), the accounting cost of capital can be quite high (17% to 24%) because these companies have high SG&A expenditures in comparison to their market caps.
In fact, the cost of equity, when measured in this way, has a very strong negative correlation with price to sales. That’s not a coincidence: the denominator of the cost of equity is the same as the numerator of the price-to-sales ratio. The following chart shows the accounting cost of equity and the price to sales of each GICS industry group (using cap-weighted five-year averages).
One possible solution to this conundrum is to divide the actual costs of equity by book value, or the combined costs of equity and debt by total assets, ignoring the market value of equity. The disparity between the companies I’ve just mentioned would decrease substantially, and there would no longer be any correlation, negative or positive, with value ratios. But other disparities would arise; the variability of cost of equity would be even higher.
At any rate, we can see that the actual expenses that contribute to the cost of equity for managers are often far lower or higher than the conventional costs of equity assigned to companies when calculating their intrinsic value.
Moreover, the cost of equity is conventionally based on the market value of equity, and that’s precisely what one wants to ignore when calculating intrinsic value. And the problem with using book value rather than market cap is that book value has little relationship to the sale and purchase of shares. If the cost of equity is lower for expensive companies than for cheap ones—as it almost inevitably will be—then the intrinsic value of those expensive companies will be significantly higher as a multiple of their future cash flows. Imagine applying discount rates of 1% to Amazon and Carvana and 24% to Fossil Group! Clearly, the accounting or historical cost of capital can be very different from an investor’s idea of the cost of capital.
One might think that there might be another relationship. Managers are incentivized to give investors the returns they’re expecting. Amazon’s and Carvana’s shareholders expect a much higher return than 0.65%. And they obtain it through increases in the price of the stock. If their stock prices fell significantly, perhaps Amazon and Carvana would feel compelled to pay dividends or buy back shares in order to reward their investors, thus raising their cost of capital.
But I’ve looked at company history, and the historical cost of capital of companies tends to fall in a certain range for each company. It’s generally a rather persistent measure, not particularly subject to mean reversion. I have very little hope that the accounting cost of capital for Amazon is going to rise to 7% at some point, nor that the accounting cost of capital for Bed, Bath & Beyond will eventually fall to 7%.
Moreover, there is a significant positive correlation between shareholder payout growth and a prior increase in share price. Companies whose prices are falling are more likely to subsequently cut dividends and issue more stock.
In other words, there appears to be no relationship whatsoever between actual historical equity costs and future cost of capital, if one defines the latter by expectations of returns.


Comments
Log in or sign up to join the conversation.