
Part Six: Myron Gordon and the Expected Cost of Equity
Is looking at the historical or accounting cost of capital entirely useless, then? Did I just waste your time and mine for no reason?
I don’t think so.
Let’s go back to Myron Gordon’s dividend discount model, as laid out in his 1956 article “Capital Equipment Analysis: The Required Rate of Profit.” This model posits that the cost of capital (which Gordon called “the rate of profit”) is equal to the dividend yield plus the dividend growth rate (and of course the dividend yield is dependent on the price).
Here’s the derivation:
P = D / (k – g)
where P is price, D is dividend, k is the discount rate, and g is the perpetual growth rate (this model assumes that the dividend will grow at exactly the same rate forever). It’s relatively easy to get to this equation when you look at how you would calculate the current price of a bond, or any other investable asset that pays recurring dividends.
Rearranging things, you get
k = D / P + g
and D / P is the dividend yield.
Of course, this begs the question. If the whole point of calculating the cost of equity (k) is to arrive at a fair value ((P)), we can’t very well use P in our calculation of the cost of equity. But Gordon wrote that this model is useful for determining the present rate of profit implied by the current dividend and current price.
Currently, analysts favor using free cash flow rather than dividends; Michael Mauboussin uses the net operating profit after taxes and adds/subtracts the cash flow from investments; Gordon himself used earnings yield in place of dividend yield for some stocks; and the concept of shareholder yield, which is the sum of dividends paid and net equity purchased (equity purchased less equity issued), can be a valuable one too.
As for g, that needs to match whatever you’re using for yield. You then have to average that with terminal growth rate used to calculate the discounted cash flow model. I use 2.16% myself, since that’s 80% of real GDP growth over the last fifty years. (When doing discounted cash flow analysis, it’s quite a bit easier to use the average of the initial growth and the terminal growth than to change the growth every year, and the results aren’t terribly different.)
If we follow these guidelines, we can come up with the stock’s “rate of profit,” or the cost of equity implied by the stock’s current price. This seems to me as good a proxy for cost of equity as anything I’ve seen. (We have to exclude stocks with negative yields here or else Gordon’s math doesn’t hold up.)
So, for example, if we use free cash flow, Amazon’s yield is 1.82%, and I estimate its short-term free cash flow growth to be 16.06%. If you add 1.82% to the average of 16.06% and 2.16%, you get a cost of equity of 10.93%.
This number would be far, far lower were you relying on shareholder yield rather than free cash flow yield, but that makes sense too—you need to use a much higher cost of capital for free cash flow analysis than you do for shareholder yield analysis, since the payout is so much higher for free cash flow.
While all of this seems, at first, useless for a valuation model since it relies on exactly the same inputs as the model does, conceptually, it’s a very useful way to think about cost of capital: the sum of yield and growth.
And it relates directly to the accounting cost of equity. How?
Remember that the accounting cost of equity gives more weight to dividends and share buybacks than to any other expenditures—it counts those at 100%. And those are precisely the costs that determine shareholder yield. So there is a real and practical relationship between the accounting cost of equity and the expected cost of equity. All one has to do is take the accounting cost and add growth—if, that is, you favor shareholder yield rather than earnings or free cash flow yield.
Part Seven: The CAPM Cost of Equity
In the late 1960s, about a dozen years after Gordon published his paper, a group of academics came up with a very different way of thinking about costs of capital. Why? Because Gordon’s model says nothing about risk. As Desai writes,
So where do these expected returns (that become costs of capital) come from? Providers of capital will measure the risk that they are exposed to and expect returns to compensate for that risk. The demand for additional returns to bear risk is a foundational idea in finance and relates to risk aversion.
But immediately, these academics made one rather faulty assumption, an assumption which the large majority of investors and writers on finance (including Desai) still hold to: that risk and return are always positively correlated.
Here are two essential facts that give the lie to this assumption:
- equity investors generally have an appetite for risk—certainly not all of them are risk averse;
- in the equity space, risk and reward are not very well correlated (I’ve written an article about this here).
Extremely risky stocks generally deliver lower returns than safe stocks. A stock with a small margin of safety, a huge ratio of debt to EBITDA, and no history of dividend payments is by all three of these measures riskier than one with a large margin of safety, a manageable debt load, and a steady record of dividends. And the latter stock will likely produce a much higher rate of return for investors. The average one-year return of an S&P 1500 stock with a debt-to-EBITDA ratio greater than 10 that has paid no dividends in the past year and has a price-to-sales ratio greater than 3 is 10.78% (going back to 1999 and using Compustat data via Portfolio123); the average one-year return of an S&P 1500 stock with a debt-to-EBITDA ratio less than 3 that pays dividends and has a price-to-sales ratio less than 0.5 is 17.43%. That’s a huge difference in favor of the less risky investment.
Most academics and investors who calculate the cost of equity do so by using the Capital Asset Pricing Model: they take a risk-free rate and add to it the stock’s beta times an equity risk premium. In fact, about ten years ago the Association for Financial Professionals found that 90% of respondents to a survey they sent to their members who use discounted cash-flow analysis calculate the cost of equity by using the CAPM.
This makes no sense by any measure.
- A stock’s beta is, as I’ve proven mathematically, inversely correlated with its alpha, so the higher a stock’s beta, the lower its expected return compared to the market. About fifty years of academic research has corroborated this basic fact.
- The risk-free rate is almost always based on bond yields, which have at many times been inversely correlated with equity returns; this means that the equity risk premium is going to be even more volatile than equity returns themselves. In fact, one study of 150 textbooks found that the equity risk premium varied from 3% to 10%.
I’m not saying that risk should not be a consideration when coming up with a cost of equity. Obviously, investors are going to demand a higher discount rate for risky companies, and if you apply a higher discount rate to a risky company you’ll get a lower intrinsic value. Risk shouldn’t be ignored. But it should not be viewed as equivalent to expected returns.
Part Eight: What Should We Do?
We’re faced with a conundrum. Whether you are a manager of a company or an investor in that company, the cost of equity is an essential consideration. But we’ve learned that calculating it presents some very thorny problems.
The cost of equity to managers and to investors is not the same, but it is related. And companies cannot ignore shareholder expectations. The cost of equity is not just a convenient fiction.
Let’s turn to Desai once more.
The cost of capital is not about who you are. It’s about what you’re investing in.
Every investment has a cost of capital. It may vary over time, but it should not differ between an investor and a manager. After all, the investor has voting rights and the manager usually holds shares. The cost of capital to the company should be the same. It may be tempting to declare that the discount rate, the required rate of return, and the accounting cost of capital are actually three entirely different numbers. But that denies the commonality between managers and investors.
To avoid the CAPM traps, I believe that the best way to estimate the cost of equity of a firm is to look at the cost of equity of similar firms. And the best way to do that is to use Gordon’s equation: yield plus the growth of that yield.
This, I believe, solves the conundrum entirely. For one thing, it makes common sense that the higher the yield, the greater the risk—we’ve already seen that in terms of the cost of debt. In addition, the higher the growth rate of an industry, the more risky companies in that industry will be.
Yield plus growth of comparable companies is a measure that satisfies practically any requirement of the cost of equity. It relates to manager’s actual costs, since yield and cost are financial equivalents. It relates to expected returns, which is the basis for Gordon’s model. It relates to risk, as I’ve just explained.
How does one define “similar firms”?
I would posit that there are two things to take into consideration:
- What industry group is the company in?
- How big is it?
Why not take into account how mature the company is? Because the cost of capital is used to estimate forever numbers.
This will present certain problems. In some groups (particularly in health care), a majority of companies may have negative free cash flow yields and/or negative free cash flow growth. The same is true of shareholder yields and dividend growth. You can mitigate these problems to some extent by defining your group widely and using five-year averages and forward-looking estimates. But in some instances, you’ll still end up with negative figures.
In order to solve this problem, I apply the following fix: the cost of equity cannot be less than 1.25 times the terminal growth rate, and cannot be less than 1.25 times the cost of debt.
Why?
In order to calculate the terminal value in discounted cash flow analysis, you take the final value in year ten, or year five, or however far you’re going and divide it by the difference between the cost of capital and the terminal growth rate. You can’t have a negative number in there. In addition, the cost of debt cannot be greater than the cost of equity, otherwise nobody would ever buy stocks.
Part Nine: A Step-by-Step Guide to Calculating the Cost of Capital
- Calculate the free cash flow yield. The formula is unlevered free cash flow (free cash flow plus taxable interest expense) divided by enterprise value. I use an average of the five-year history (or one-year if that’s not available), the current year’s estimate, and next year’s estimate, adjusting the estimates a bit since, historically, estimates have always exceeded actuals. If the company is in the financial sector, I’ll use 70% of net income divided by market cap (free cash flow is difficult to determine for financial companies, and the ratio of free cash flow to net income for those companies is about 70%).
- Calculate initial free cash flow growth. This is the average of the average five-year free cash flow growth rate (or one-year if that’s not available), the current year’s estimate’s growth over the most recent year, and next year’s estimate’s growth over the current year’s estimate, estimates adjusted according to historical overestimation. I winsorize all of these at –25% and 40% before taking the average. For financial firms I do the same but for net income instead of free cash flow.
- Calculate overall free cash flow growth. This is the average of the initial free cash flow growth and the terminal growth rate, which I’ve set at 2.16%.
- Calculate the company’s cost of debt. This is the five-year average interest expense divided by the five-year average total debt. If that’s not available, I use the most recent annual figures. If the company is in the financial sector, cost of debt does not apply.
- Get comparable free cash flow yields, overall free cash flow growths, and costs of debt. First, I limit the universe of stocks to those with analyst estimates for free cash flow, unless they're financial companies, in which case analyst estimates for earnings is good enough. Then I find the median market cap of each industry group so that I can classify each company as large or small. If it’s large, I get the median free cash flow yield, overall free cash flow growth, and cost of debt for all companies with a market cap greater than 0.8 times the industry group median. If it’s small, I get the median numbers for all companies with a market cap less than 1.25 times the median.
- Calculate the comparable cost of equity. This is either the sum of the comparable free cash flow yield and comparable free cash flow growth, 1.25 times the terminal growth rate, or 1.25 times the comparable cost of debt, whichever is greater.
- Calculate the cost of capital. This is the comparable cost of debt times the company’s debt plus the cost of equity times the company’s total equity, all divided by the sum of the company’s debt and equity.
I’ve made all of these calculations public in a screen on Portfolio123 which, if you’re a member, you can access here.
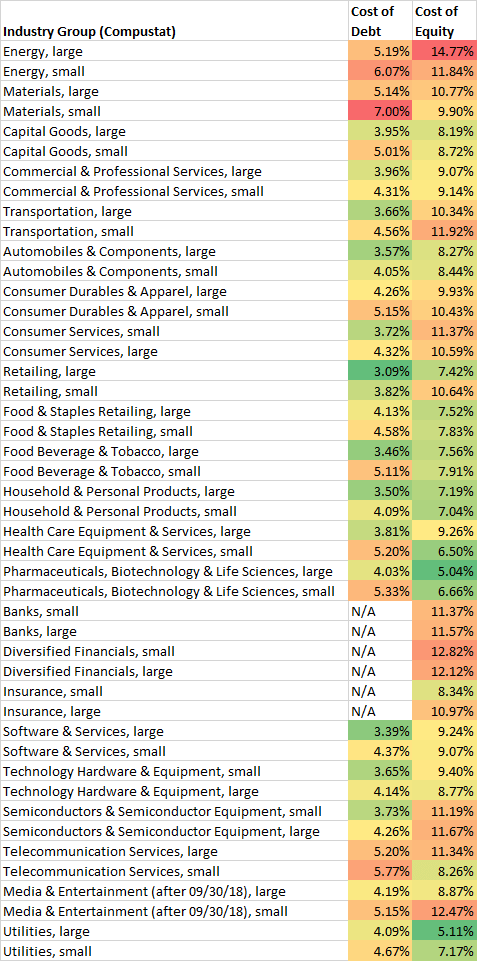
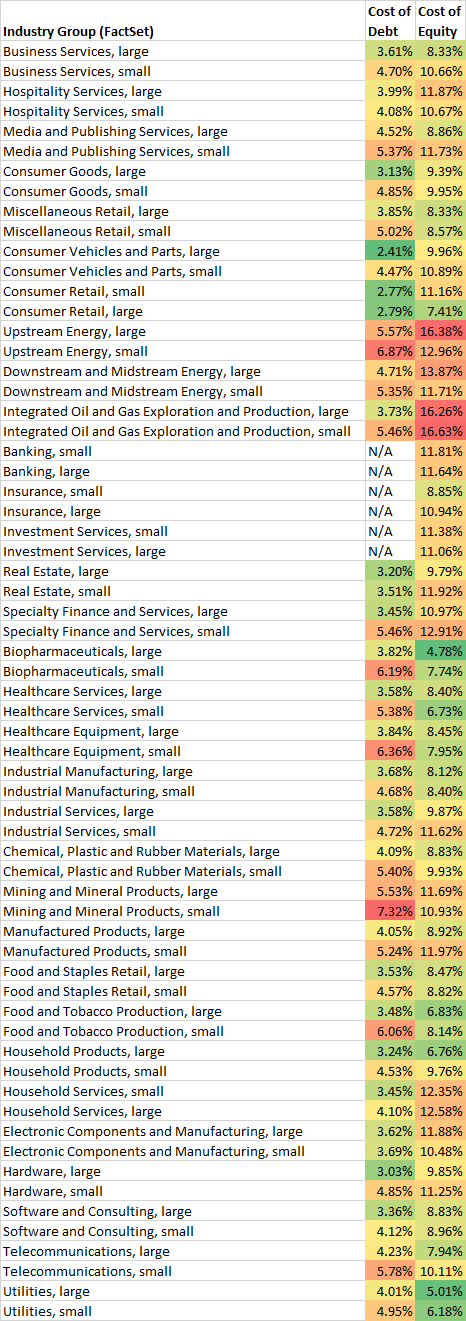
Part Ten: Current Costs of Debt and Equity by Industry Group
Here are the current costs of debt and equity by industry group, using both Compustat and FactSet classifications. (The cost of capital will depend on the ratio of debt to equity.)
Part Eleven: Using the Cost of Capital in Calculating Intrinsic Value
I use a ten-year model that’s pretty simple. Using the numbers I computed above, here’s what I do:
- Calculate the company’s unlevered free cash flow (or, if it’s a financial company, 70% of its earnings). I use the average of the five-year average (or, if that’s not available, the most recent annual figure), the current year’s estimate, and next year’s estimate. This is free cash flow for year zero, which I’ll abbreviate as FCF0.
- For FCF1 through FCF9, the formula is FCF0 + |FCF0|*((1 + FCFGr)Y – 1), where FCFGr is overall free cash flow growth as calculated in step 3 above and Y is the year 1 through 9. This formula allows me to use negative numbers.
- FCF10 is the terminal value, which is FCF9 * (1 + cost of capital) / (cost of capital – terminal growth). If FCF9 is negative, it’s 2 * FCF9 * (1 + cost of capital) / (cost of capital) – FCF9 * (1 + cost of capital) / (cost of capital – terminal growth).
- Intrinsic value is then FCF0 + FCF1 / (1 + cost of capital) + FCF2 / (1 + cost of capital)2 + FCF3 / (1 + cost of capital)3 + . . . + FCF10 / (1 + cost of capital)10.
You then compare this to the company’s enterprise value (or, if it’s a financial company, to its market cap). If it’s within a reasonable distance, the company is fairly valued; if it’s very much larger than the enterprise value, the company is undervalued, and if it’s very much smaller, it’s overvalued.
I’ve chosen 25 companies at random—a good mix of large and small—and run all these numbers. If both Compustat and FactSet estimates are available, I’ve averaged the two; otherwise I’ve gone with one data provider.
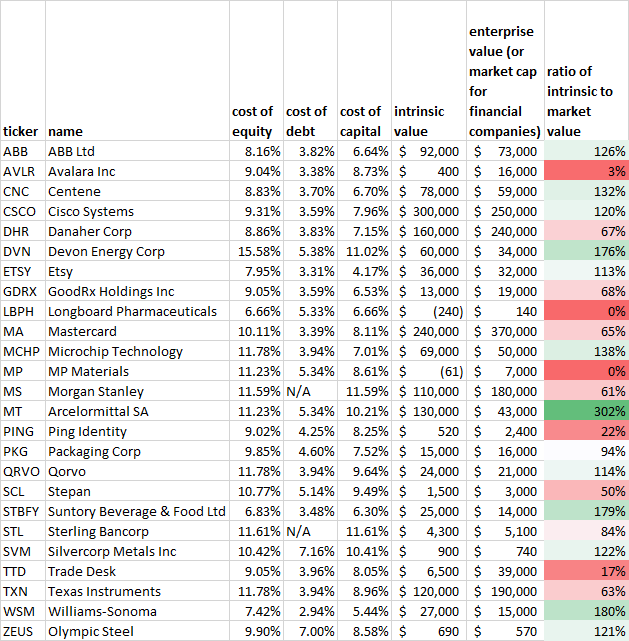
The main factor in coming up with these intrinsic values is, unsurprisingly, each company’s recent and estimated free cash flow. That explains why some of the numbers there may appear somewhat strange.
I would categorize any company whose ratio of intrinsic to market value is between 50% and 200% as fairly priced. That means that only one of these companies—ArcelorMittal—is truly underpriced, while five are truly overpriced.
Part Twelve: Conclusion
I began writing this article about four months ago with this main idea: the cost of equity, as it’s currently calculated, makes no sense. How else can I calculate it?
It took me weeks and weeks to come up with an answer. Along the way I explored all sorts of possibilities. Could one use the actual costs of equity of a company? Could one adapt the CAPM model so that it accounted for the inverse correlation of alpha and beta and the instability of the equity risk premium? Could one use a constant cost of equity for all companies pegged to the real rate of return of the stock market?
I found my answer by
- talking to an analyst who actually values private companies,
- going back to Myron Gordon’s original 1956 paper on the dividend discount model, and
- using a comparative approach, since when we approach our expected return on an investment, we look at that of similar companies.
I hope that the result will be useful to those readers who use the cost of equity in their investment decisions.


Comments
Log in or sign up to join the conversation.