
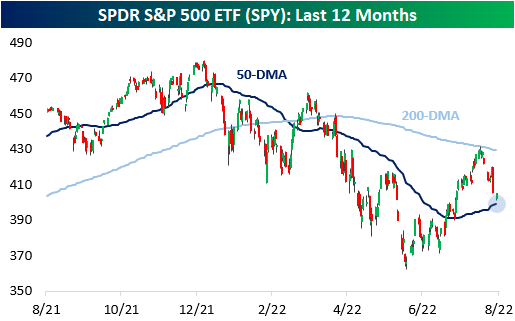
After Friday’s brutal selloff, the major US indices have been bouncing around in Monday’s session as investors weigh Powell’s hawkish comments. With this selloff comes a test of the 50-DMA, which the major indices broke above in mid-July. For those who follow technicals, this is a critical level where bulls want to see support and bears want to see the stock break definitively below. On the bright side, most major indices are holding up, at least for now.
Starting with the S&P 500 (SPY), the index is currently trading just 1.4% above the 50-DMA just two weeks after testing the 200-DMA. SPY didn’t quite touch the 50-DMA in Monday’s trading but came close enough to make the occurrence notable, and as of now is more rangebound between these moving averages than anything else.
The Nasdaq 100 ETF (QQQ), on the other hand, did test the 50-DMA in Monday’s session. It found support at this level, and is now trading 64 basis points above this critical level. QQQ has a very similar technical setup to SPY, as both have been rangebound by the 200 and 50-DMAs. QQQ currently has the widest spread between the 200 and 50-DMAs of the major US indices due to higher volatility.

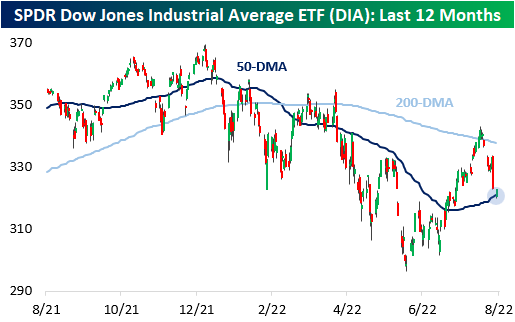
The Dow Jones Industrial Average ETF (DIA) did cross below the 50-DMA Monday, trading 35 basis points below the level at the intraday lows. DIA saw support at these levels as well and is now trading 61 basis points above the 50-DMA as investors bought the dip. Unlike SPY and QQQ, DIA never fully tested the 50-DMA in late July and was able to break the 200-DMA in mid-August. Unfortunately for bull, the brief stint above the 200-DMA did not last, and DIA came crashing down. DIA also has the narrowest spread between the 200 and 50-DMAs at 5.2% due to lesser volatility.
Interestingly, the Russell 2000 ETF (IWM) is relatively distanced from the 50-DMA, trading 3.1% above the level as of this writing. This is more than twice the distance than the next closest major index ETF (SPY: 1.4%). Although this may imply that IWM has further downside before finding support, the index is actually outperforming QQQ on the day. However, IWM is having a worse day than both SPY and DIA. The technical setup on IWM is quite similar to DIA.

Long story short, investors should watch how the major indices trade around their respective 50-DMAs. Further recovery tomorrow would imply support around the 50-DMA, which would be bullish in the near term. If we see this support tomorrow, we would not be surprised to see the major indices retest the 200-DMA, but the potential results of that test is a topic for another day.
More By This Author:
Quotes From August Earnings
Sentiment Slide
2022 Slams Stocks And Bonds


Comments
Log in or sign up to join the conversation.