
Four weeks ago, I predicted that the 12% market correction we had seen would turn into a true bear market. Bear markets are often defined as a decline of more than 20% for the major market indexes, but I find it more useful to focus on long term changes in investor sentiment.
What I did not predict was just how severe the effect of the coronavirus shutdown would be on the economy. I thought we would need the combined of effect of the shutdown and investors re-assessing their risk tolerance to bring us into full bear market territory. Now, a month later, it seems clear to me that the economic effects alone are enough to justify a 20% decline.
I still believe that the current period of uncertainty will have a long term effect on investor risk tolerance. That means that even when we have the economy functioning back at 2019 levels (which I don’t expect until 2022) the stock market will probably be trading at a lower valuation than it was in January 2020.
Readers, mark your calendars with a note to check if the S&P 500 is trading above its peak of 3,393 in January 2020. If it goes above that, do me the favor of calling me on it… I’ll write a mea culpa, and hopefully will be able to draw some lessons that will let all of us learn from my mistakes.
First Quarter Performance
(Click on image to enlarge)
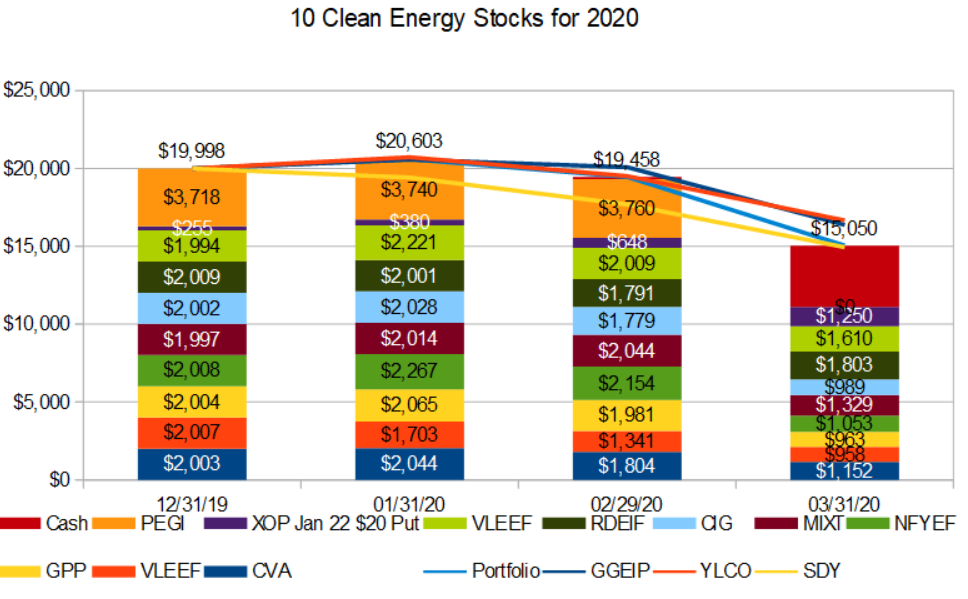
Despite a successful hedging strategy, my Ten Clean Energy Stocks for 2020 model portfolio has now lost almost 25% of its value since the start of the year. This is better than its broad market benchmark (SDY), which is down a little over 25%, but it is well below the rather resilient performance of its clean energy income stock benchmark, the Yieldco ETF YLCO.
My real-money managed portfolio, the Green Global Equity Income Portfolio (GGEIP) has done almost as well as YLCO and is down 18% for the year to date.
Keeping Perspective
The losses all around are large, and when you are looking at a portfolio that’s down 20% to 30% year to date, it’s easy to get overwhelmed. This interferes with good decision making. In order to maintain my perspective, I also like to look a longer time periods. Fortunately, 2019 was a blockbuster year for my portfolios, so zooming out a longer time period can be comforting. Here are the returns for the portfolios and benchmarks over the last 12 months and since January 2019:
(Click on image to enlarge)
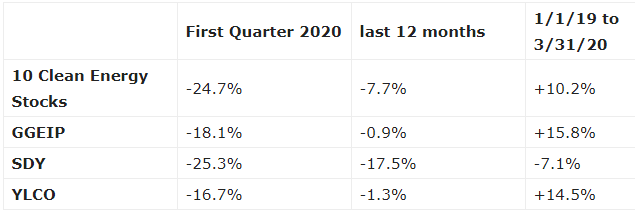
It’s a little easier to think about the next move when you think of your account as up 10% to 15% since the start of 2019 (like both clean energy income strategies and their clean energy benchmark) as opposed to thinking of it as down by one-sixth to one quarter since the start of the year.
What’s Next?
Now that we have reassured ourselves that, despite the ongoing bear market, we’ve still made money by investing in clean energy income stocks since the start of 2019, it’s a little easier take the long term view going forward, rather than focusing on “making up” for recent losses.
The sharp rally we have seen in the stock market since the recent low on March 23rd is most likely driven by people who are worried about missing out on the recovery and focused on “recovering” recent losses.I think many are rushing in too quickly.
If the stock market were only reacting to the COVID-19 shutdown, the 25% decline in SDY so far this year is probably enough to compensate for the lost earnings. But if I am correct that this downturn will cause investors to re-evaluate their overall risk tolerance, the bear market bottom is still somewhere in our future.
How the Bear Might Play Out
I expect that as investors grapple with the new reality, the market will remain volatile for months to come. We will see multiple sharp rallies (like the one since March 23rd) and declines. The March 23rd lows will be broken for many stocks, and likely for stock market indexes as well. I expect the final market lows to be ten to twenty percent below most stock indexes’ current level. When the true bull market finally begins, the continuing high volatility will likely mask the increase. There will be continued sharp declines, but successive bottoms will not quite reach the previous lows, and the long term rise will only be clear in retrospect.
All of the above are simply my best guesses. With any prediction so complex, I will almost certainly be wrong about parts of it. While that is what I expect, I also expect to be surprised.
Trades
Although I do not think we have reached the bottom, the incredible decline in fossil fuel stocks leads me to believe that the risks and rewards of owning the January 2022 $20 Put on XOP have changed. For the purpose of the model portfolio, I am selling it at $12.50, netting $1,250 cash for the portfolio to reinvest. This is the midpoint of the bid and the ask price at the close on March 31st. As I write on April 1st, XOP is down $1.46 from last night, so readers may be able to get a little more for it.
I will also note that the buyout of Pattern Energy Group was completed in March, meaning that we did not collect the expected $0.422 dividend which would have been awarded on March 31st, but the portfolio did collect $26.75 per share in cash. Combined with dividends from other holdings so far this year, the portfolio has $5,193 available to invest.
Given that volatility remains high, and I expect further sharp declines followed by sharp rallies, selling cash covered puts is likely to be a profitable strategy in the coming months. So rather than selling at current market prices, I will sell using good-til-canceled limit orders. If the market does not hit my limit prices, the portfolio will still have the cash. If it does, we will have one or two new positions.
Here are the orders I will be using for the model portfolio:
Sell to Open 1 HASI Oct 16, 2020, $20 Put, at a limit price of $4 or better. (This will require $1,600 in cash to secure the put – $2,000 minus the $400 premium.)
Sell to Open 1 EBAY Jan 15, 2021, $28 Put, at a limit price of $3.60 or better. (This will require $2,440 to secure the put.)
Sell to Open 1 CVA Sep 18, 2020, $7.50 Put, at a limit price of $1 or better. ($650 required to secure the put.)
If the limit prices above are reached, I will add the puts to the portfolio in the next monthly update.
Stock notes
I will discuss why I like Hannon Armstrong (HASI), eBay (EBAY) and Covanta (CVA) for selling cash-covered puts at the current prices in another update over the next few days. For now, I want to get you these trades as quickly as possible. Stay Tuned!


Comments
Log in or sign up to join the conversation.