
One repeated theme in the current round of earnings is that personal consumption is slowing down. Last month, McDonald’s, Starbucks, and many other retail-oriented stocks fell on weak sales. This week, we are reminded again via poor sales from Target, Lowes, and Macy’s. All three reported a decline in sales compared to last year. Target’s sales beat estimates slightly, while its earnings per share fell short. While that may not seem too bad, expectations for Target’s sales were meager. Target, which opened down 8% on Wednesday, had the following to say:
Higher interest rates, economic uncertainty, high credit card balances, and other factors have [consumers] concerned, and consumer confidence took a meaningful dip in April.
To put a broader context into the declining retail sales growth in companies like Target, Walmart, and, in general, the “cheaper” retail sectors, we compile revenue growth data for a number of similar companies and compare them to prior earnings and in the aggregate. The graph on the left shows that only two companies, Walmart and Dollar Tree, have increased sales growth compared to the 2021-2022. Walmart is the only one showing higher sales growth today versus the three years before the pandemic. The second graph weights the annual sales growth for the ten companies. As we share, the aggregate weighted sales growth has reached its lowest since 2017.

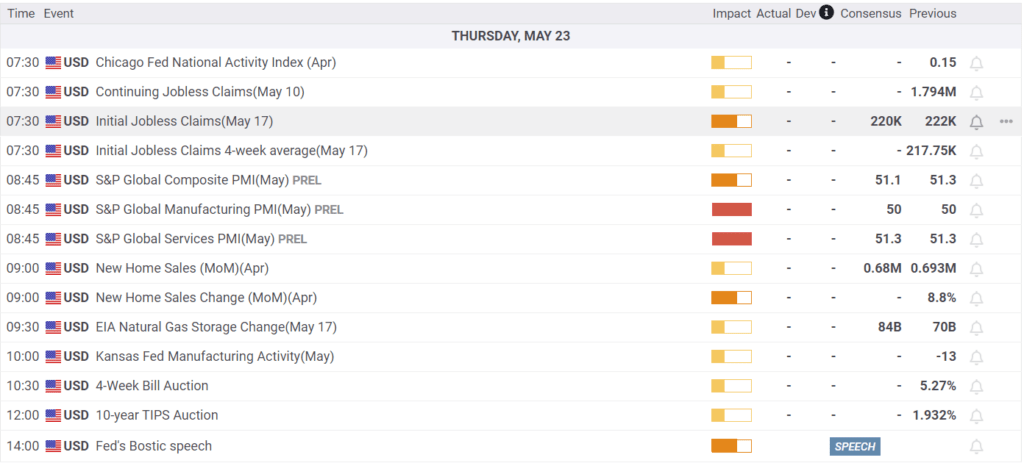
What To Watch Today
Earnings
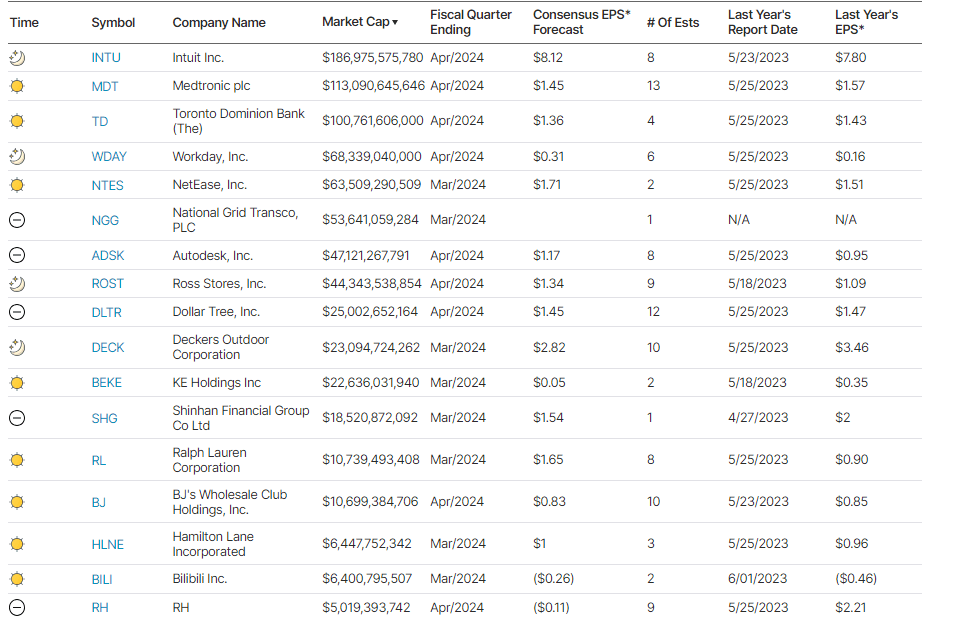
Economy
Market Trading Update
In yesterday’s commentary, we discussed how the release of the FOMC minutes could well impact the market. Such happened as the market sold off after its release as the minutes reiterated much of the commentary from recent Fed speakers that rate hikes are likely on hold near term. While there is always some dissension among Fed members, there were a couple of quotes that spooked the market.
“Various participants mentioned a willingness to tighten policy further should risks to inflation materialize in a way that such an action became appropriate.
Although monetary policy was seen as restrictive, many participants commented on their uncertainty about the degree of restrictiveness.
Participants suggested that the disinflation process would likely take longer than previously thought.“
While these points were just discussions during the meeting, the Federal Reserve unifies around the decisions it makes with Chairman Powell leading the way. From all of the recent speeches from Fed members as of late, they remain clear that rate cuts will likely begin at the September meeting with the reduction of the Fed balance sheet beginning in June.
Nonetheless, with the markets overbought and well deviated from longer-term means and sentiment becoming exceedingly bullish, the market was ripe for a pullback. The 20-DMA, which has now crossed above the 50-DMA, will return as key support for the market advance, as we saw at the beginning of this year. A pullback to support should be expected; all that is needed is a short-term catalyst. Use pullbacks to add exposure as needed.
(Click on image to enlarge)

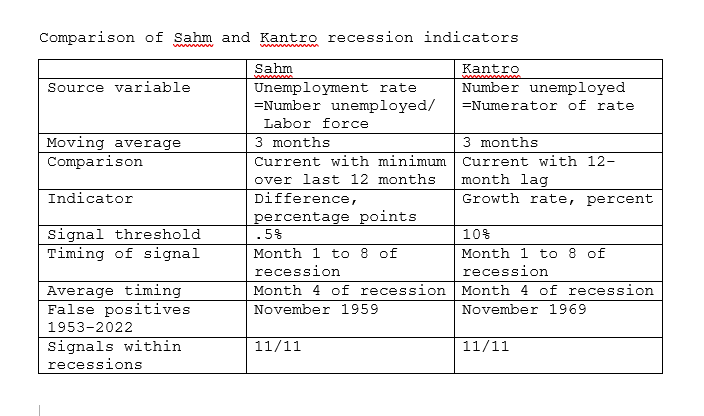
Sahm And Kantro Models Call For A Recession
The Sahm and Kantro recession indicators are closely related but process the data differently. Both rely on the unemployment rate and its current status versus prior readings. Unemployment tends to be very cyclical. It is either rising, and the economy is in or near a recession, or it is falling and the economy is growing. Neither model has missed a recession since 1953 nor given a false positive since 1970.
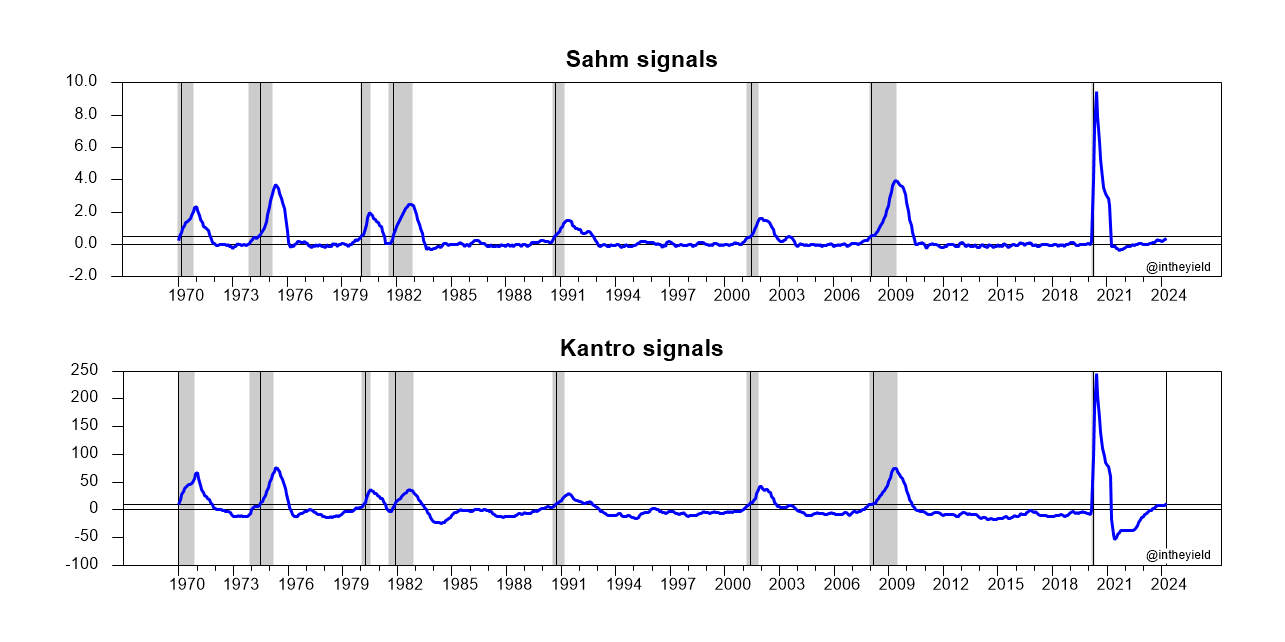
Given the recent uptick in unemployment, the Kantro model signals a recession, and the Sahm model is very close. The model rules and a graph showing prior data are below. In the graph, the black vertical denotes the recession signal.
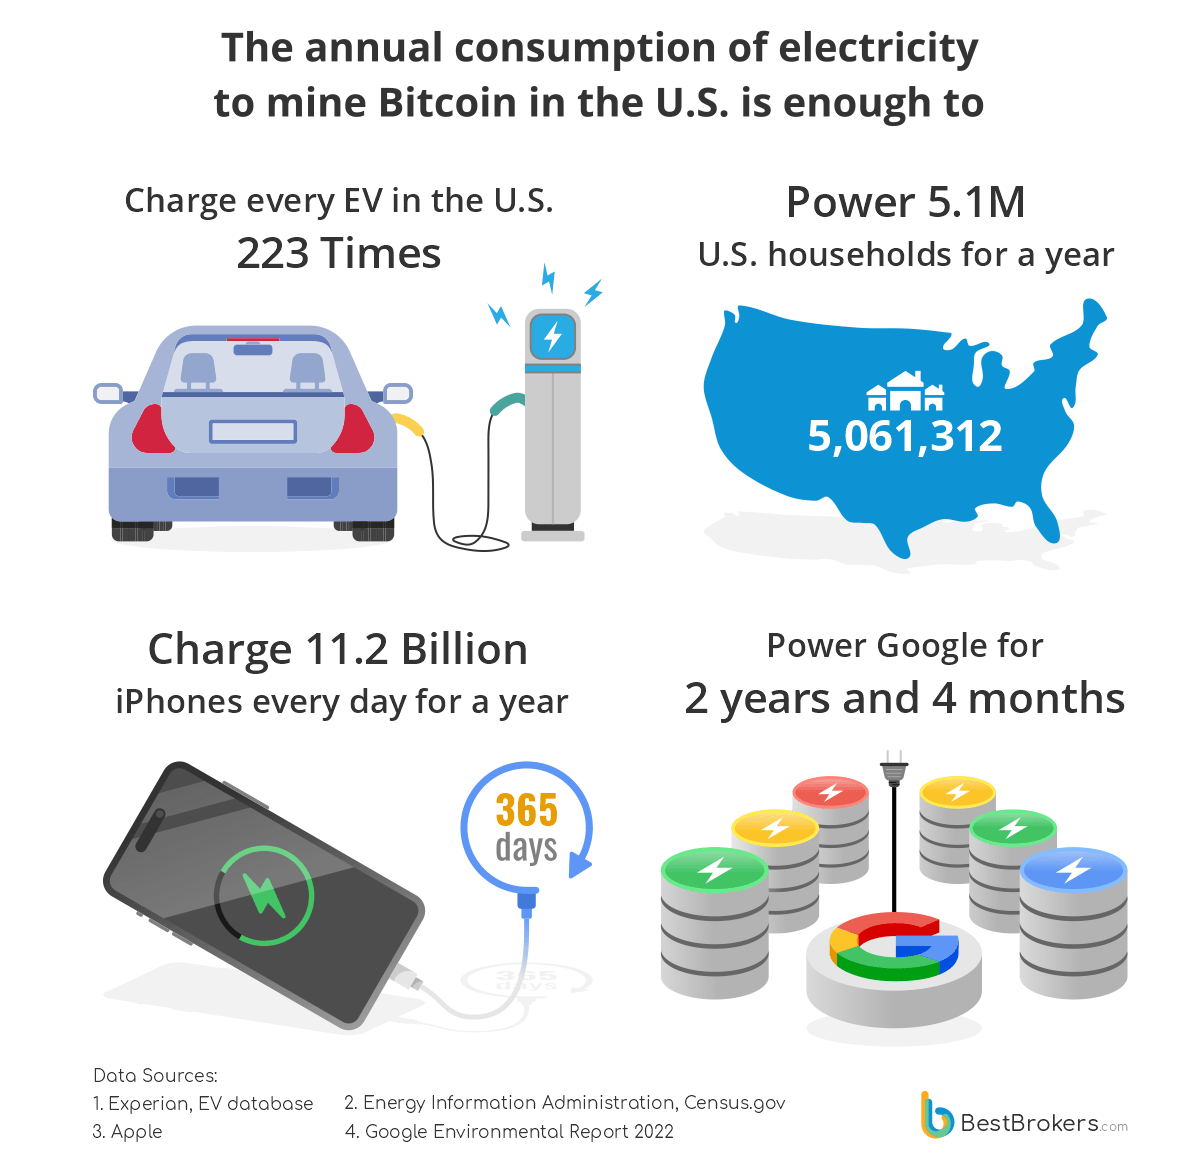
Bitcoin Mining Consumes Enormous Amounts Of Electricity
Bitcoin’s halving in April means it will now take twice as much computing power to mine one bitcoin as it did prior to the halving. To put perspective on the amount of electricity that bitcoin miners use, we share some excerpts from a recent report by Paul Hoffman at Best Brokers.
Currently there are 450 Bitcoins mined daily and this costs the mining facilities a whopping 384,481,670 kWh of electrical power. This comes at 140,336 GWh yearly and is more than the annual electricity consumption of most countries, save for the 26 most power-consuming ones.
When this power expenditure was resulting in 340.82 BTC mined up until 20 April 2024 before the halving, it was still economically feasible to mine Bitcoin in the U.S. by using grid power entirely. This is no longer the case and the fact the U.S. mining facilities are still operational points to the notion that they are relying mostly on their own renewable energy sources and/or have special deals with suppliers.
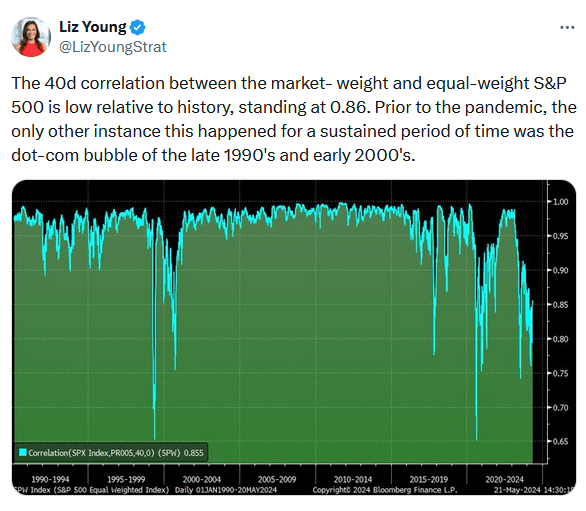
Tweet of the Day
More By This Author:
Market Divergence Prompts An Important Question
Benchmarking Your Portfolio May Have More Risk Than You Think
Nvidia Earnings: What To Expect


Comments
Log in or sign up to join the conversation.