
“Recently, we have had confusing divergences in the major stock market indexes,” starts a reader’s question. He goes on to ask why there are days like Monday when one index is down by a decent amount and another posts moderate gains. On Monday, for instance, the Dow Jones Industrial Average fell by 0.50%, The Nasdaq 100 rose by 0.70%, and the S&P 500 split the difference, being up slightly.
Appreciating the weighting and composition of market indexes when considering why such divergences occur is important. For example, Nvidia was up 2.50% yesterday. It has a 6.37% weight in the Nasdaq 100, a 5.10% weight in the S&P 500, and is not in the Dow. Here’s another: Goldman Sachs fell by 1% yesterday. It is the second largest holding of the Dow at 7.7%, but it only represents .34% of the S&P 500 and is not in the Nasdaq.
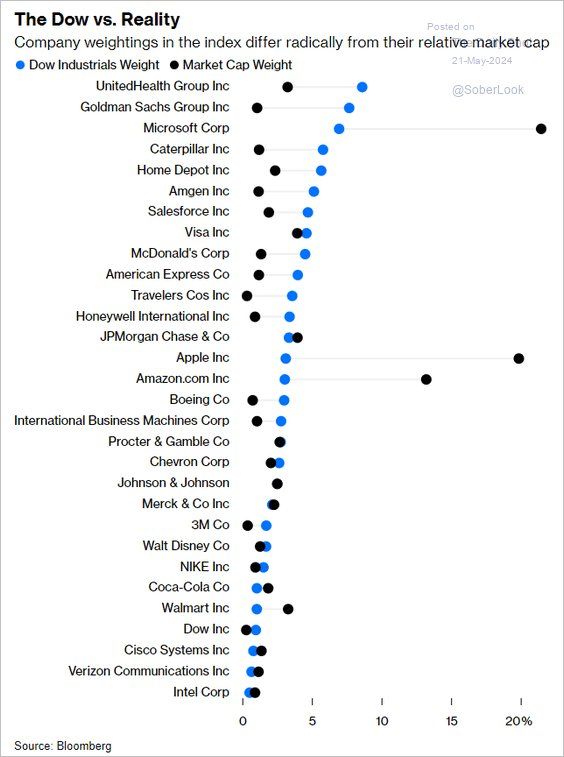
As the examples highlight, the stocks in the index matter, as do their weightings. The Dow is weighted by price and is composed of stocks from a wide swath of the economy. The S&P 500 represents the largest 500 stocks by market cap traded in the U.S. Unlike the Dow, the stocks are weighted by their market caps. The Nasdaq is also market cap-weighted and comprised of large-cap companies, many with a technology orientation that is determined by a committee. The graph below shows how weightings can vary significantly between indexes. Given these significant weighting and composition differences, it’s unsurprising that stark market divergences can occur when certain stocks and sectors are in favor, and others are out of favor.
What To Watch Today
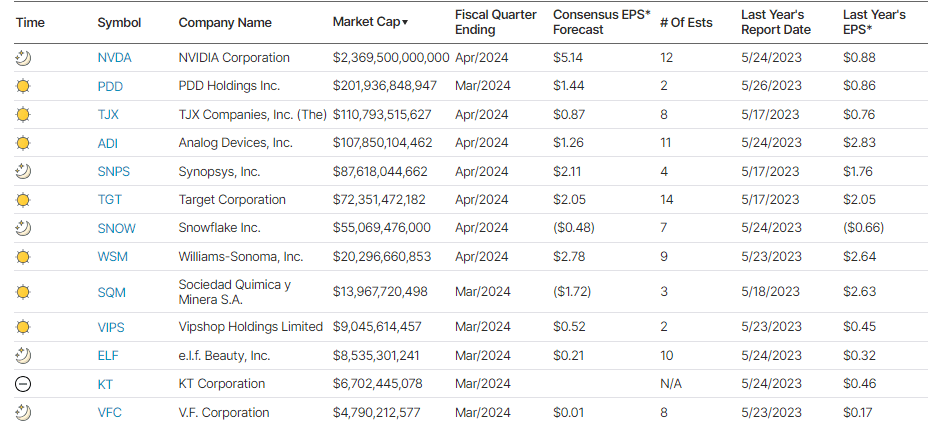
Earnings
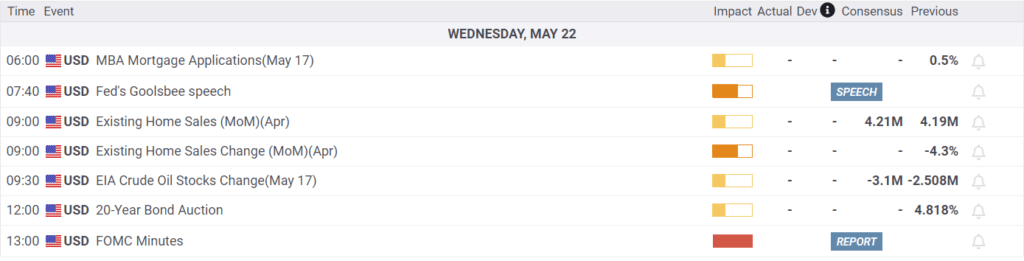
Economy
Market Trading Update
Yesterday, we discussed the extended deviations in most major markets and sectors, particularly gold and gold miners. Of course, today is probably the season’s most anticipated earnings report, which Nvidia (NVDA) will announce after the bell. There is little guesswork at their earnings report will be a beat of estimates, however, it will be the forward guidance on GPU sales that makes or breaks the stock after hours. As we have seen this year, stocks that provide in-line or weaker guidance have been decently punished. Stocks that have provided optimistic guidance have been rewarded. We can lay out a basic risk/range analysis for NVDA post-earnings with that knowledge.
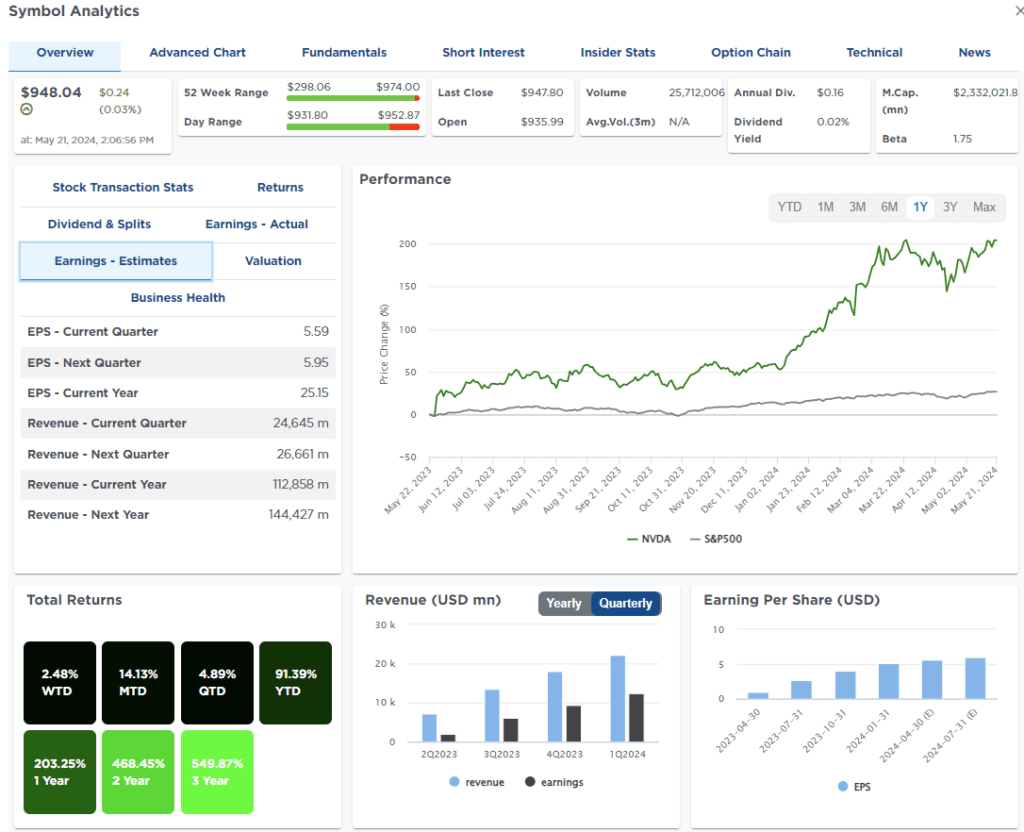
First, NVDA is already trading well into the top of its 52-week range. Estimates for the current quarter are $5.59/share for the current quarter and $5.95 for the next quarter on expectations of $24.645 billion in revenue. That part is set pretty high going into next year, with full-year revenue estimates at $144.427 billion. (This data chart is found in SimpleVisor)
The chart below uses a standard Fibonacci retracement sequence to estimate the potential gain and loss following the earnings announcement. This is just a guess, and reality could be anywhere along or outside the current spectrum, depending on the announcement. However, our best guess is that if the announcement exceeds expectations, we should probably expect a 10%ish gain, given that NVDA is already trading 2 standard deviations above its 50-DMA. A disappointment could lead to a decline to retest the April lows, which would border on 20%.
(Click on image to enlarge)
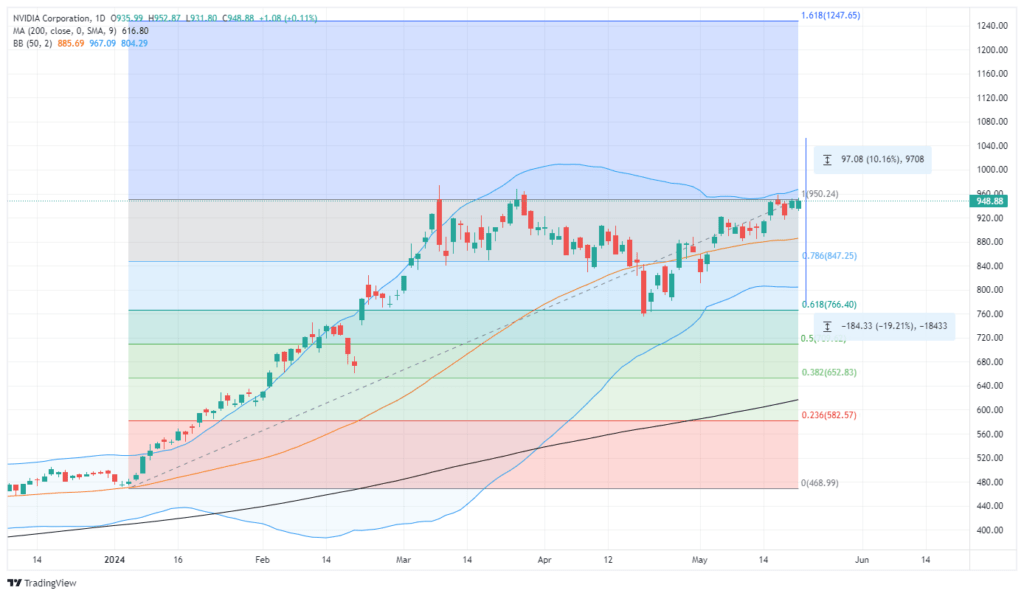
Given a risk/reward ratio of 2:1, such is why we reduced our position in NVDA back to model weight yesterday. Once we are past earnings, we can decide the next entry point to add back to our holdings if warranted.
Skillman Grove Research Offers Caution
In their latest piece, Jim Colquitt provides readers with a needed perspective on where the market is and what may lie ahead. To wit;
All else being equal, this would suggest that you should skew towards being long the market. With that said, there are times when the most prudent thing to do is to take some risk off the table.
While a grind higher is certainly possible, in his opinion, he offers readers caution, particularly if a recession is in the near future. He notes that the market drawdowns of the last three recessions ranged from -35.4% to -57.7%. Equally importantly, returning to prior highs can take a lot of time. While 2020 was unique and only required half a year to recover its losses, the recessions of 2008 and 2001 took 5.5 and 7.3 years, respectively.
Throwing additional caution to the wind, Jim brings up a concerning model. To wit:
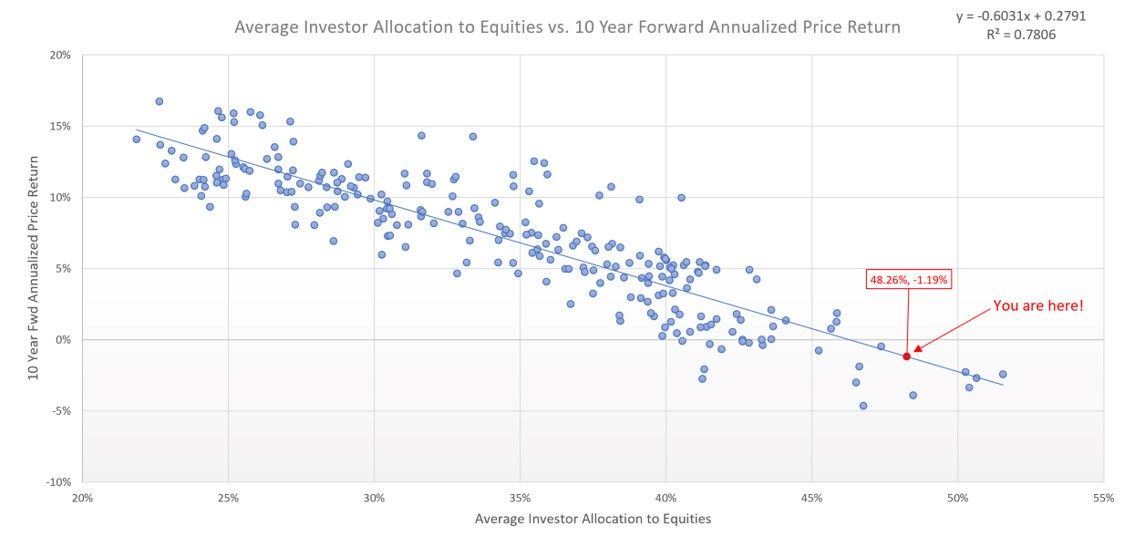
The market may continue to move higher from here; however, leveraging the work I’ve done with my “Average Investors Allocation to Equities” model (read more here), I would suggest that extended bull market runs typically do not begin from this point in the economic cycle.
His graph below shows that forward returns tend to be low when investors have high equity allocations. Based on the graph, a negative return over the next ten years is a reasonable forecast. However, the graph doesn’t show how the returns of the next ten years will play out. Might the market continue higher for five years, fall significantly in year six and then grind higher? There are infinite iterations. The advice is to be aware of the current situation and be ready to protect yourself. However, understand that bull markets are hard to predict and can often run longer and higher than most investors expect.
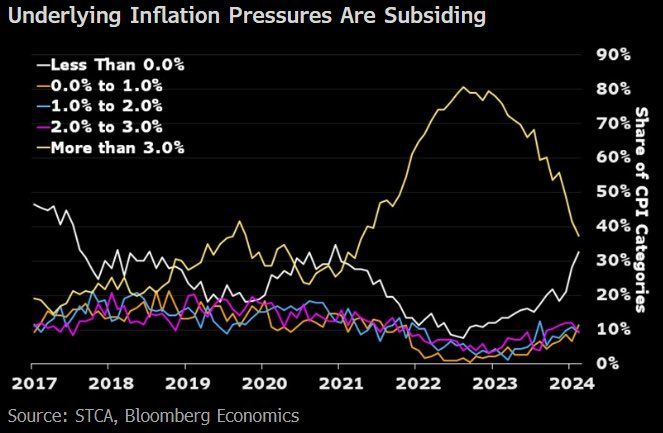
Underlying Inflation Pressures Are Easing
The graphic below from STCA and Bloomberg shows that the share of CPI categories with more than 3% inflation (yellow) is falling rapidly. At the same time, the share of components with negative inflation readings is increasing. While this is a good measure of the breadth of inflation, it does not account for weighting. As we have noted, shelter prices account for 40% of CPI. So, as shelter prices go, so goes CPI.
Tweet of the Day
More By This Author:
Benchmarking Your Portfolio May Have More Risk Than You Think
Nvidia Earnings: What To Expect
Summer Driving Season is Late This Year- Signal Or Noise?


Comments
Log in or sign up to join the conversation.