
Stagnation Is Lulling The Fed To Sleep
The JOLTs data released on Wednesday paint a picture of labor market stagnation. The graph below shows that the number of job openings has fallen to levels similar to those right before the pandemic. While the number of openings seems somewhat stable, layoffs are slowly increasing, while new hires are near a 15-year low.
Similarly, the ADP indicator signals labor market stagnation. This week, ADP said the economy added 41k jobs in December. The second graph shows that the three-month average job growth is a mere 20k. Unlike during the few years of the pandemic, ADP data has recently become more closely correlated with BLS employment data. Thus, we expect today’s BLS report to show a gain of 25-50k jobs.
Assuming 25-50k job growth is the norm, the employment situation is becoming problematic in slow motion. On the positive side, the economy is adding some jobs. Furthermore, the pace of layoffs is slow. That said, the economy is not adding enough jobs to keep up with the growing workforce. Bear in mind that the labor force has been increasing by approximately 125k people every month. Our concern is that labor market stagnation is taking a slow toll on consumers’ financial well-being and sentiment. It’s not severe enough to cause a jump in the unemployment rate and prompt much lower Fed Funds rates, which means this slow-motion stagnation, or degradation, could continue. As Fed member Stephen Miran believes, the Fed is being lulled to sleep by stagnation and “boring” jobs data, rather than taking action to reverse the trends before it’s too late.

What To Watch Today
Earnings
- No earnings releases today
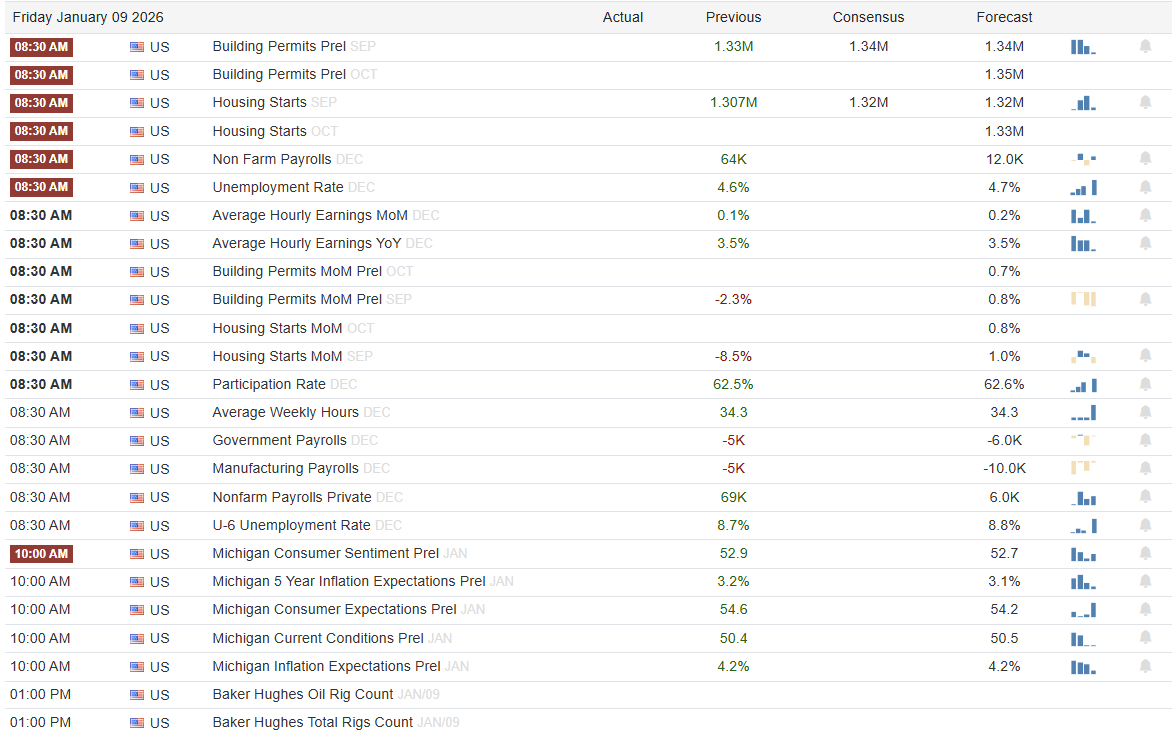
Economy
(Click on image to enlarge)
Market Trading Update
Yesterday, we touched on the recent improvement in breadth as the Magnificent 7 stocks have lagged somewhat out of the gate this year. Notably, the market has continued to trade in a more volatile fashion as of late, with a rapid internal rotation of market sectors. While some of this may be attributed to beginning-of-year rebalancing, there is a not-so-subtle risk that the failed “Santa Claus” rally will suggest more disappointing returns over the next month or two. As shown, when the “Santa fails to visit Broad & Wall”, January tends to have a negative return, along with the potential for a negative Q1.

Will that be the case this year? No one knows, but from a technical perspective, markets are overbought, and as shown yesterday, they are trading at the top end of their long-term trend. With money flows weakening, and a negative divergence in momentum, the risk of a pickup in volatility should be expected.
(Click on image to enlarge)

There is decent support at the 20- and 50-day moving averages, but a break below that could trigger more aggressive selling. This is because both the momentum and money flow indicators suggest that buyers are currently scarce, which potentially leaves a decent gap to lower support levels.
While there is no reason to be overly bearish, the recent action suggests that being more “risk aware” may prove fruitful over the next couple of weeks until we get into earnings season.
Five Days Of Commodity Volatility
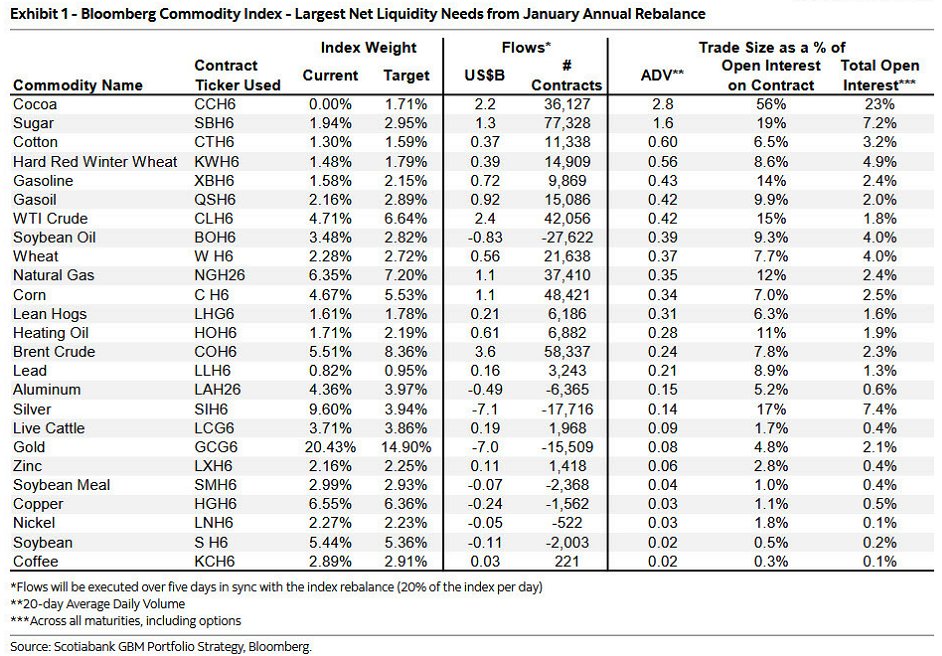
Starting on Thursday and lasting five days, commodity investors will face a predictable wave of volatility from index rebalancing. This short period differs from other days, when commodity prices are driven by typical technical and fundamental market forces. Once a year, the major commodity indices such as the S&P Goldman Sachs Commodity Index (GSCI) and the Bloomberg Commodity Index (BCOM) publish their index target weights. As shown in the BCOM Index below, the table lists the 2026 target weight for each commodity and its current weight. Funds that track the index must rebalance to reflect these new weights.
Last year’s volatility, including significant gains in precious metals, has created an imbalance that is more pronounced than typical. For example, silver rose about 150% last year. Accordingly, its weight in the BCOM Index is currently about 6% above the new target. Similarly, gold, which rose over 50%, is over 5% overweight. Conversely, the energy complex, which traded poorly last year, is underallocated. Thus, as a result of index rebalancing, funds will need to sell precious metals and buy oil. The table below quantifies the potential impact as a percentage of each commodity’s open interest. For example, in aggregate, investors need to sell $7.0 billion in gold contracts and buy $2.4 billion in crude oil contracts.
Understanding Inflation Impact On Investments
Inflation has a sneaky talent; it rarely arrives with fireworks. It shows up in the small stuff first. A higher grocery bill. A pricier dinner out. A “wait, when did flights get this expensive?” moment. Then, if it sticks around, it starts changing the math inside your portfolio.
That matters because investors aren’t chasing numbers for fun. You’re investing to fund a future lifestyle, support a business transition, create income in retirement, and preserve wealth across generations. When the inflation rate rises, the goalposts move. The same portfolio return can feel less satisfying because purchasing power has quietly slipped.
Key Takeaways
- Understanding inflation’s impact on investments starts with the difference between nominal performance and real returns.
- Inflation does not hit all asset classes the same way; some benefit while others face pressure.
- Cash and longer-term bonds tend to be most vulnerable when inflation surprises to the upside.
- TIPS and commodities can play a role as an inflation hedge, but sizing and discipline matter.
- A diversified plan can protect purchasing power without chasing market noise.
Tweet of the Day

More By This Author:
Fed Challenges: Bill Dudley’s Take On 2026
Minerals, Russia, China & Iran: More On Venezuela
Precious Metals Aren’t Predicting Economic Collapse
Disclaimer: Click here to read the full disclaimer.


