
In July of 2021, after the pandemic and the liquidity issues that arose in 2019, the Fed established a new liquidity backstop. This program, the Standing Repo Facility (SRF), allows financial institutions to borrow on a collateralized basis from the Fed. Unlike the Overnight Reverse Repurchase facility (ON RRP), which allows financial institutions to park excess liquidity at the Fed, SRF does the opposite. Financial institutions can pledge collateral to the Fed and, in exchange, receive an overnight loan, i.e., liquidity.
The SRF should be valuable in times of liquidity shortfalls, although it has yet to be tested. The Fed discourages daily use of the facility by setting the borrowing rate on the SRF at the upper end of the Fed Funds range. For instance, today the Fed Funds range is 4.00% – 4.25%. The facilities borrowing rate is 4.25%. Most financial institutions can borrow at the SOFR or Fed Funds rates, both of which are typically in the middle of the Fed Funds range (4.10%-4.15%).
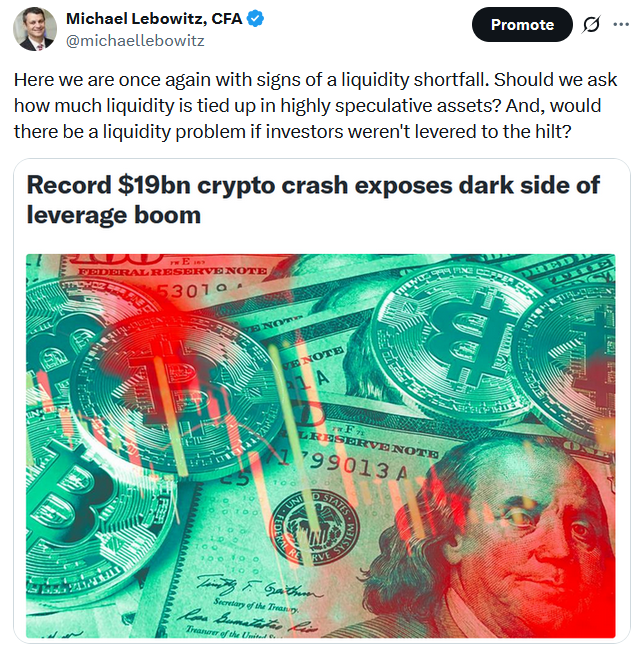
As we noted in our Commentary from October 17, the SOFR rate was at a 20-30 basis point premium due to what appears to be a liquidity shortfall. Accordingly, the SRF is a cheaper funding source and is being employed. While the usage is serving its purpose as a liquidity backstop, it also alerts the market to liquidity problems. Thus, a new risk arises if financial institutions now fear that liquidity is scarce and refrain from providing liquidity to the market.
The graph below shows that the program is rarely used. Before the recent usage, the two previous instances occurred at quarter ends, when liquidity is often in a temporary shortfall.

What To Watch Today
Earnings
(Click on image to enlarge)

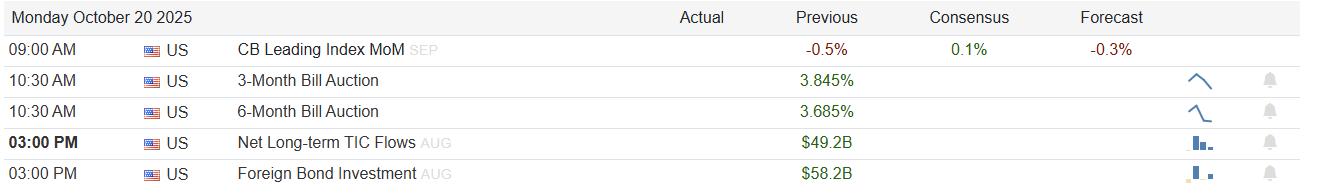
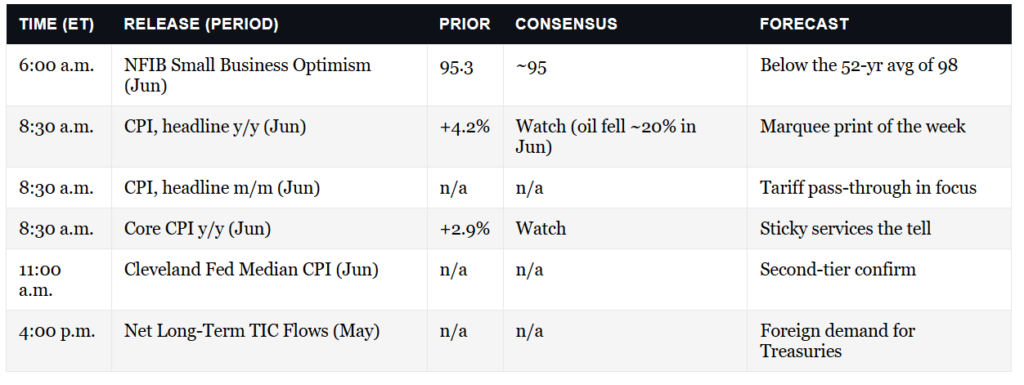
Economy
(Click on image to enlarge)
Market Trading Update
The S&P 500 ended Friday on a positive note, despite a weak open, at 6,664.01, rising roughly 0.5% and capping a volatile week. The Dow and Nasdaq posted similar gains, helped by a late-week rebound in financials and easing rhetoric on trade. While the bounce relieved some pressure, it followed a volatile trading week.
Volatility surged as investors recalibrated risk with the Volatility Index (VIX) spiking to levels not seen since early spring, touching 28 on Friday morning before settling at 20.78. This surge marked a renewed recognition of headline risk and broader market instability. Options markets are now pricing in more violent swings, and that shift in implied volatility suggests that rallies will remain vulnerable to reversals.
Market internals also deteriorated over the week. Breadth narrowed further, with gains heavily concentrated in large-cap growth and technology stocks, particularly those tied to AI and defensives. Mid- and small-cap stocks lagged significantly. The 52-week high and low readings remained mixed even during the rebound, indicating a bifurcated market beneath the surface despite the headline strength.
As shown, momentum indicators are on a sell signal, which will likely cap gains short-term, and relative strength readings have reversed from overbought territory and are cooling off with the pullback. The rebound into Friday helped preserve near-term support at the 50-DMA, but the underlying trend has weakened. Rising correlation across risk assets suggests that macro factors, liquidity, rates, and credit dominate technical setups. However, despite the volatility this week, the market remains bullish, and the consolidative action maintains a more constructive undertone.

While credit markets added to the pressure, with high-yield spreads widening modestly and short-term funding stress flaring up again, there are reasons to be cautious. If that stress continues or spreads, it could undermine the broader equity backdrop even if technical levels hold.
The current setup is defined by a tight range with clearly defined battle lines:
- Support: 6,600–6,675 zone (critical short-term floor)
- Resistance: 6,770–6,800 zone (intermediate upside target)
- Volatility threshold: VIX above 25 indicates unstable conditions, so it is worth watching next week.
- Momentum trigger: A breakout above resistance on rising volume and improving breadth would be a good sign.
As long as support holds, tactical buying remains viable, but the market operates on thinner margins. If price breaks below support, momentum-driven selling may accelerate, especially if accompanied by rising credit stress. Conversely, a clean breakout above resistance would re-engage trend-following flows but require volume and breadth confirmation. With volatility elevated, every move must be respected and hedged accordingly.
The Week Ahead
Earnings and inflation data will take top billing this week. CPI will release its delayed September report on Friday. The expectation is for an increase of 0.4%, which would bring the year-over-year rate to 3.0%. The Fed will be quiet this week as it enters its self-imposed media blackout heading into next week’s FOMC meeting. However, given recent tightness in the liquidity markets, as we discussed above, we would not be surprised to see a leak to the media regarding how the Fed may address liquidity. The best guess is that QT could end as early as next week’s meeting.
A good number of companies will report earnings this week. Some of the larger ones are listed below:
- Tuesday: Netflix, GE Aerospace, Coca-Cola, 3M, and Phillip Morris
- Wednesday: Tesla, IBM, GE Vernova, and Kinder Morgan
- Thursday: Mastercard, McDonald’s, Blackstone, Intel, and Honeywell
- Friday: Exxon, AbbVie, P&G, and Chevron
The Psychology Of Investing In A Zero Risk Illusion
Every market cycle eventually changes investor psychology to believe risk has been conquered. The storylines may change, from “this time it’s different” to “the Fed has our back,” but the psychology does not. When markets rise steadily and volatility remains low, investors confuse stability with safety. That’s precisely the illusion forming in markets today. The S&P 500’s relentless climb, paired with suppressed volatility and ample liquidity, has given the impression that downside risk has somehow been engineered out of the system.
This is where the trap begins. Behavioral finance tells us that people respond more to “how” risk feels than to what the data shows. When investors no longer feel anxious, they begin to take risks they wouldn’t otherwise tolerate. Rising prices reinforce optimism, optimism drives more buying, and the cycle continues until the most minor shock shatters the illusion. Low volatility environments create the psychology for instability by suppressing the healthy corrections that usually reset investor expectations. The longer the calm lasts, the more fragile the market becomes beneath the surface.
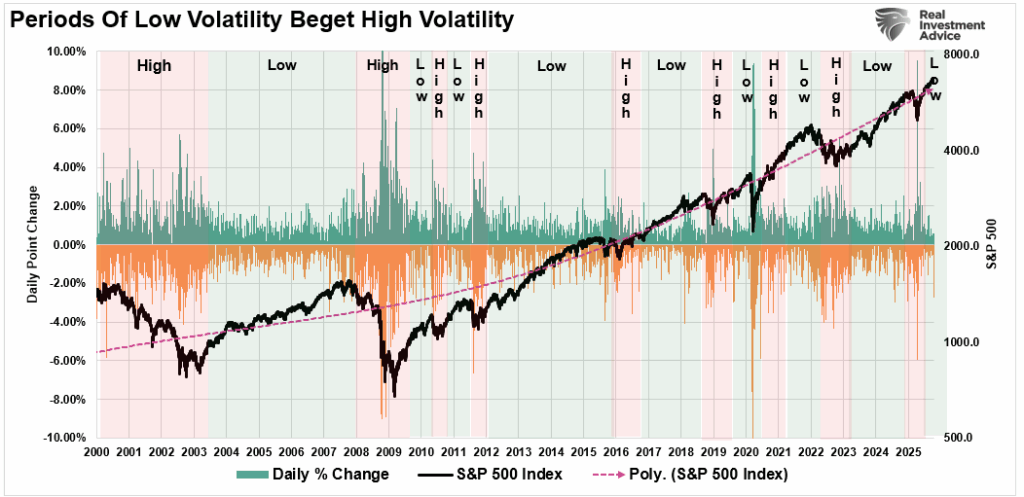
“Hyman Minsky argued that financial markets have inherent instability. As we saw in 2020-2021, asymmetric risks rise in market speculation during an abnormally long bullish cycle. That speculation eventually results in market instability and collapse. We can visualize these periods of ‘instability’ by examining the daily price swings of the S&P 500 index. Note that long periods of “stability” with regularity lead to “instability.”
Tweet of the Day
More By This Author:
Capitalism: The Road To Wealth And HappinessRecession And Bonds: Navigating The Next Recession
Miran Says Rates Are Too High: Politics Or Reality?

Comments
Log in or sign up to join the conversation.