
S&P/TSX 60 Index: Elliott Wave Technical Analysis

Image Source: Pexels
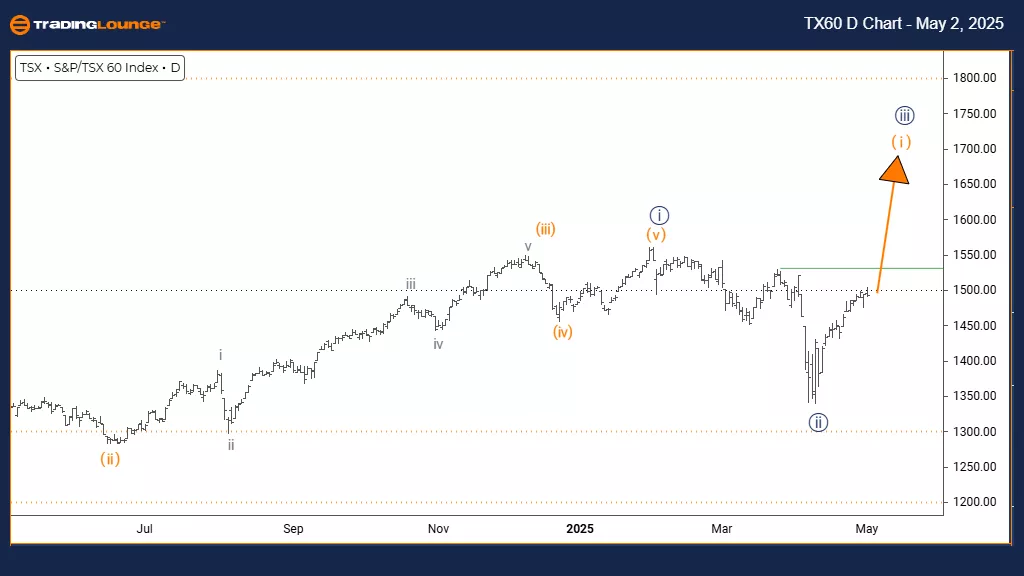
S&P/TSX 60 Elliott Wave Analysis | Trading Lounge Day Chart
S&P/TSX 60 Elliott Wave Technical Analysis
FUNCTION: Bullish Trend
MODE: Impulsive
STRUCTURE: Orange wave 1
POSITION: Navy blue wave 3
DIRECTION NEXT LOWER DEGREES: Orange wave 2
Details:
Navy blue wave 2 appears complete, and orange wave 1 of 3 is now developing.
The S&P/TSX 60 daily chart analysis highlights a bullish trend evolving through an impulsive Elliott Wave structure. The index has finalized navy blue wave 2 correction and has now entered orange wave 1 within the larger navy blue wave 3 formation. This structure suggests the early stage of a fresh impulse wave that could build significant upward momentum in the upcoming sessions.
Orange wave 1 represents the initial phase of the new impulse movement, typically characterized by growing momentum as the market builds directional strength. The end of navy blue wave 2 has laid the groundwork for this development, with wave 1 often displaying steady yet moderate progress before greater acceleration. The current setup indicates a progressive upward trend before transitioning to the next corrective phase.
After completing orange wave 1, a corrective pullback into orange wave 2 is anticipated. This retracement is expected to offer a buying opportunity ahead of a potentially stronger wave 3 rally. The daily timeframe provides an important perspective on this evolving structure, with the current impulse wave indicating early potential for establishing renewed bullish momentum.
Market participants should track the progress of wave 1 for typical impulse wave signs such as rising volume and steady price gains. The analysis suggests preparing for bullish opportunities while acknowledging that early impulse stages often move more gradually than later phases. Technical indicators and price action analysis will be vital for confirming wave development as it unfolds.
The transition into navy blue wave 3 at a higher degree signals the possibility of stronger, sustained bullish momentum ahead, making the current phase crucial for establishing strategic positions. Monitoring price action and momentum indicators closely will be key to confirming the evolving wave structure and spotting the eventual transition into wave 2.
(Click on image to enlarge)
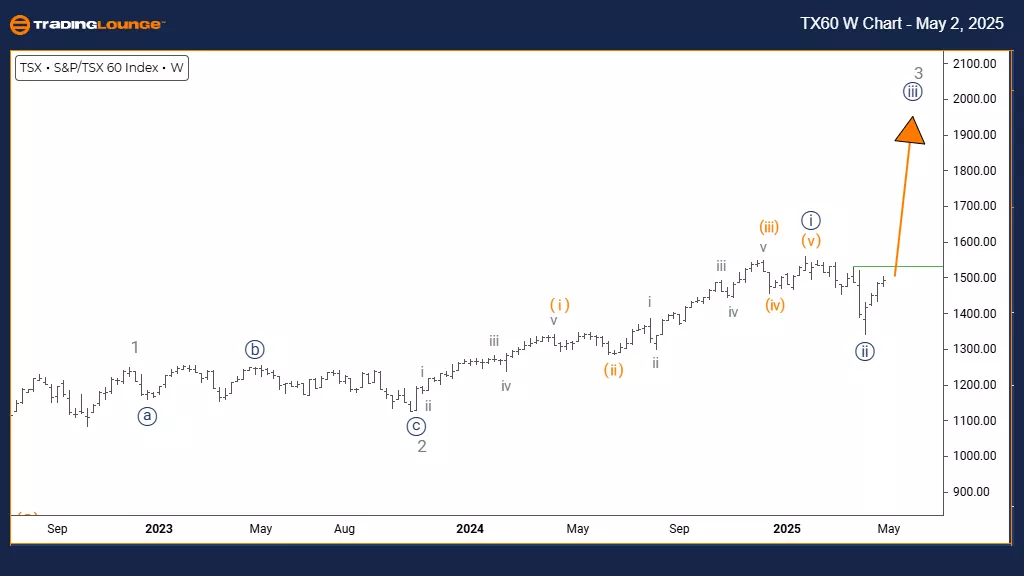
S&P/TSX 60 Elliott Wave Analysis | Trading Lounge Weekly Chart
S&P/TSX 60 Elliott Wave Technical Analysis
FUNCTION: Bullish Trend
MODE: Impulsive
STRUCTURE: Navy blue wave 3
POSITION: Gray wave 3
DIRECTION NEXT HIGHER DEGREES: Navy blue wave 3 (started)
Details:
Gray wave 2 appears complete, and now navy blue wave 3 of 3 is progressing.
The S&P/TSX 60 weekly chart analysis shows a strong bullish trend forming through an impulsive Elliott Wave structure. The index has finalized gray wave 2 correction and transitioned into navy blue wave 3 within the broader gray wave 3 framework. This positioning suggests that the market is moving into the most dynamic phase of its upward cycle, typically characterized by extended price rallies and strong momentum.
Navy blue wave 3 usually represents the core trending segment in Elliott Wave structures, often showcasing the strongest price movement aligned with the dominant trend. With wave 2's correction now complete, the stage is set for a powerful wave 3 advance, typically surpassing wave 1 in size and momentum. The current setup points toward sustained strength before the next corrective pullback emerges.
The weekly timeframe offers a vital view of this unfolding structure, suggesting that the ongoing movement is a major component of a broader bullish sequence. The transition into gray wave 3 at a higher degree reinforces the likelihood of a larger upward move across longer timeframes. Traders should monitor navy blue wave 3 for traditional bullish signals, including strong momentum, increased volume, and consistent price progress.
This analysis recommends maintaining bullish exposure during this impulsive stage while staying alert for wave 3 completion signals. Price action and technical indicators will be key tools for confirming the structure as it unfolds. After the completion of navy blue wave 3, a corrective move into navy blue wave 4 is anticipated, offering a possible pullback opportunity within the continued bullish trend.
The current phase provides an optimal environment for trend trading, as wave 3 typically delivers the most favorable conditions in Elliott Wave cycles. Careful attention to price movements will be critical for identifying the best points for participating as the trend matures within the broader bullish structure.
(Click on image to enlarge)
More By This Author:
Energy Select Sector ETF XLE - Elliott Wave Technical Analysis
Trading Strategies For S&P 500, Nasdaq 100, DAX 40, FTSE 100 & ASX 200
Qualcomm Inc. - Elliott Wave Technical Analysis
At TradingLounge™, we provide actionable Elliott Wave analysis across over 200 markets. Access live chat rooms, advanced AI & algorithmic charting tools, and curated trade ...
more

