Spot The Hidden Supply And Derive The Strength Of The Market Structure

Image Source: Pixabay
Watch the video extracted from the live session on 5 Sep 2023 below to find out the following:
- How to spot the hidden supply using Wyckoff's Efforts vs. Results.
- How to interpret the market structure
- Scenarios analysis based on the key levels of the S&P 500
- Will the head and shoulder pattern shake the market?
- And a lot more
Video Length: 00:08:20
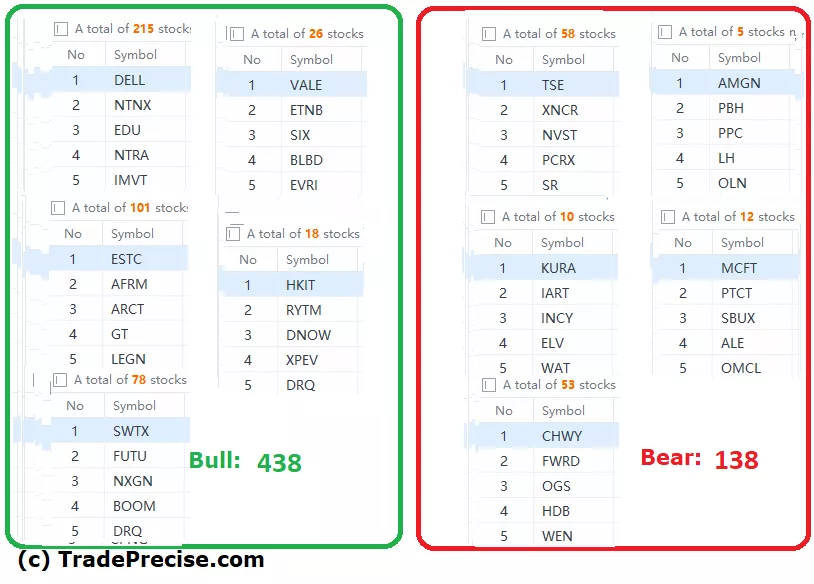
The bullish vs. bearish setup is 438 to 138 from the screenshot of my stock screener below pointing to a positive market environment.

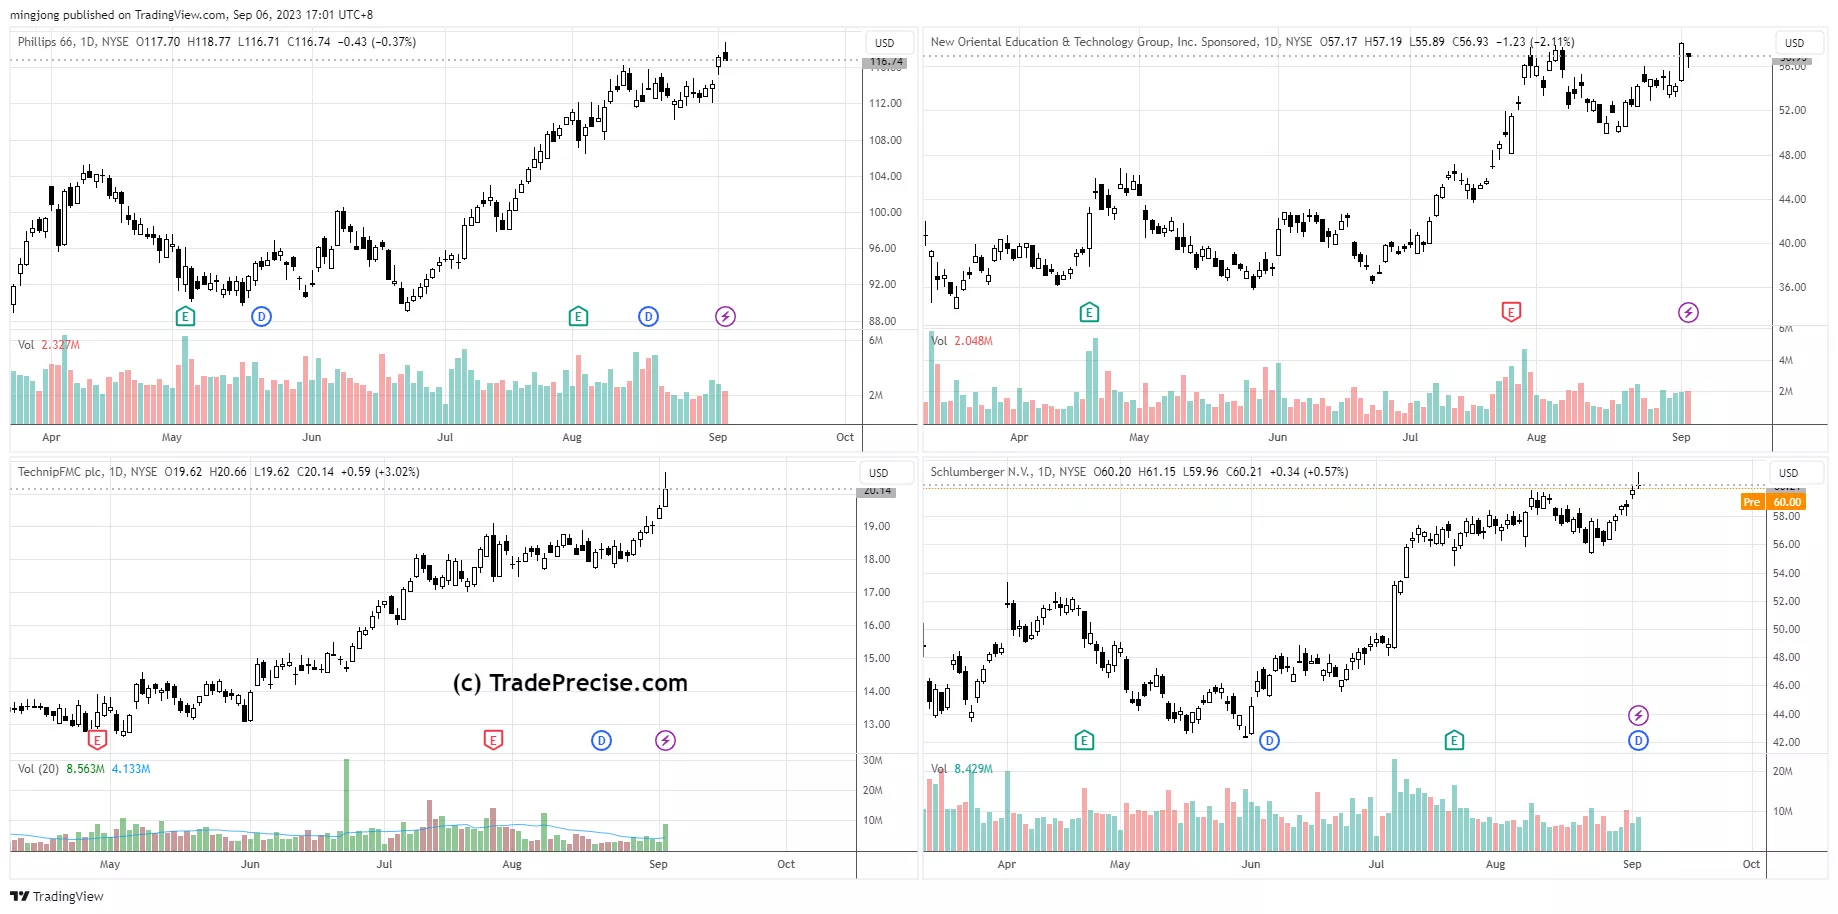
12 “low hanging fruits” (PSX, FTI, etc…) trade entries setup + 33 others (EDU, SLB, etc…) plus 7 “wait and hold” candidates are discussed in the video (51:07) accessed by subscribing members below.
(Click on image to enlarge)

Oil and gas (O&G) stocks have been outperforming for more than a month. The successful backup in the crude oil accumulation structure last week will act as a tailwind for the O&G stocks.
More By This Author:
S&P 500’s Wild Card Month: Brace Yourself For The Unexpected
Is The Channel Oversold Bounce The Start Of The Epic Turnaround?
Is It Time For Bargain Hunting To Bet On A Relief Rally?
Disclaimer: The information in this presentation is solely for educational purpose and should not be taken as investment advice.


