S&P 500’s Wild Card Month: Brace Yourself For The Unexpected
Image Source: Unsplash
Watch the video extracted from the live session on 29 Aug 2023 below to find out the following:
Image Source: Unsplash
- How to derive the tell-tale signs from last week's price action
- What to look for after a stopping action
- What to expect during the most volatile month (September)
- The short-term trend development in the S&P 500
- And a lot more
Video Length: 00:05:50
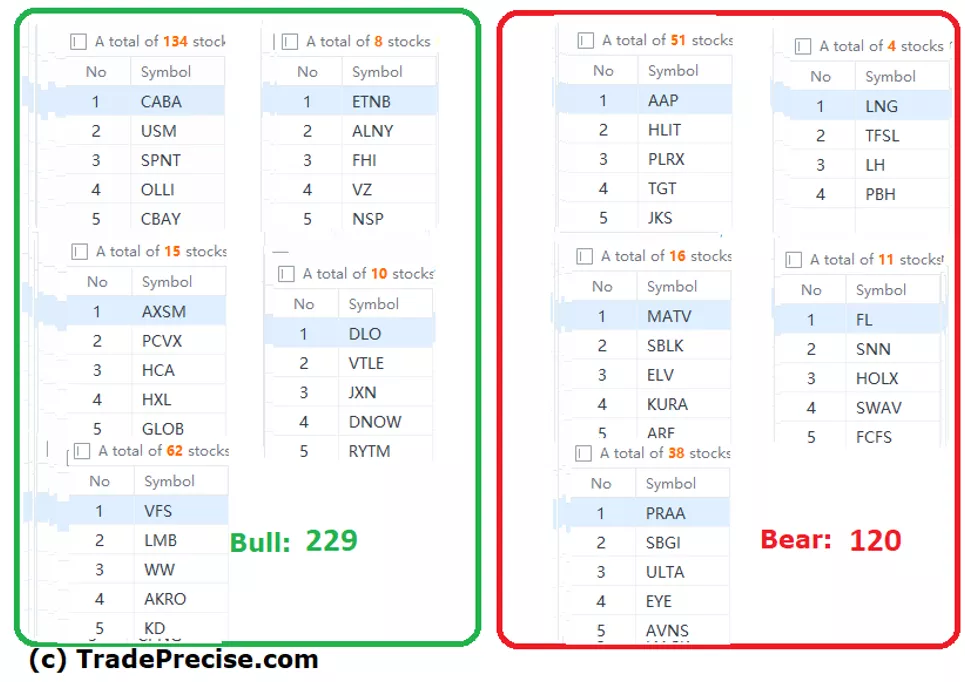
The bullish vs. bearish setup is 229 to 120 from the screenshot of my stock screener below pointing back to a positive market environment.

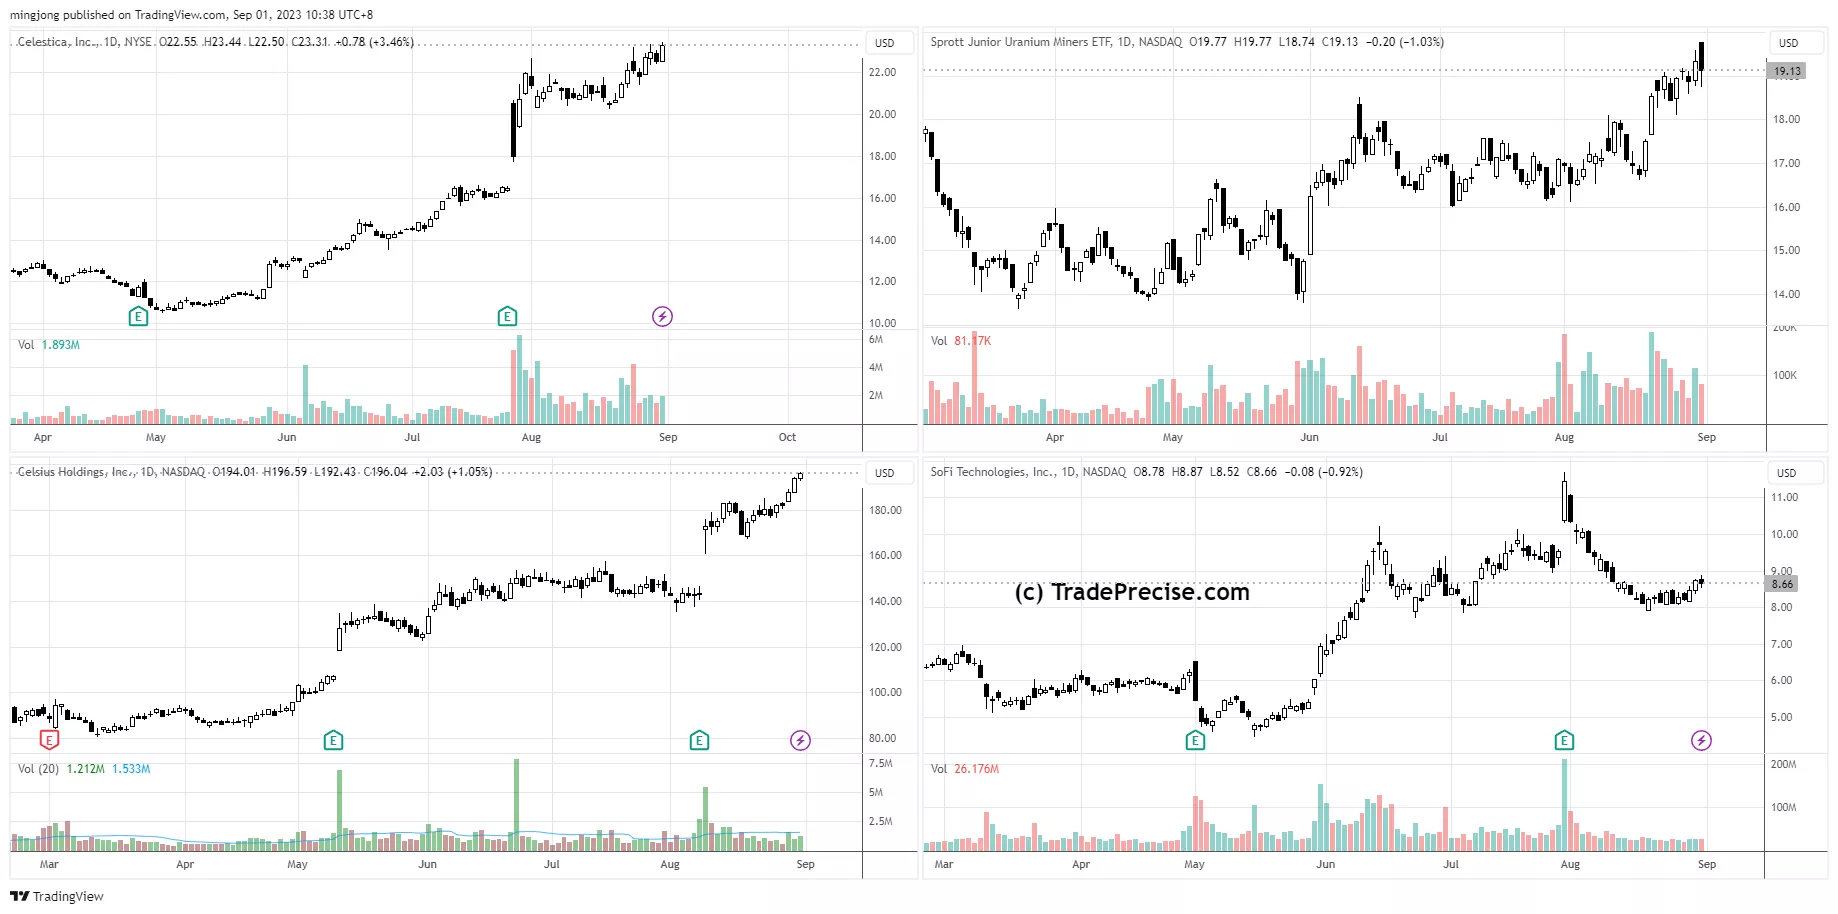
14 “low hanging fruits” (CLS, CELH, etc…) trade entries setup + 23 others (URNJ, SOFI, etc…) plus 8 “wait and hold” candidates are discussed in the bonus founding member’s video (1:30:00) accessed by subscribing members below.
(Click on image to enlarge)

More By This Author:
Is The Channel Oversold Bounce The Start Of The Epic Turnaround?
Is It Time For Bargain Hunting To Bet On A Relief Rally?
Is The Pullback Behind Us Or Still Looming? Let's Investigate
Disclaimer: The information in this presentation is solely for educational purpose and should not be taken as investment advice.


