

Image Source: Unsplash
- How to anticipate the short-term trend (the current swing).
- The key support level for S&P 500
- The most bullish case to anticipate
- The likely developing trend based on the supply level and the market structure
- And a lot more
Video Length: 00:06:56
The bullish vs. bearish setup is 220 to 260 from the screenshot of my stock screener below pointing to a negative market environment. This is expected after the ongoing market correction started 3 weeks ago.
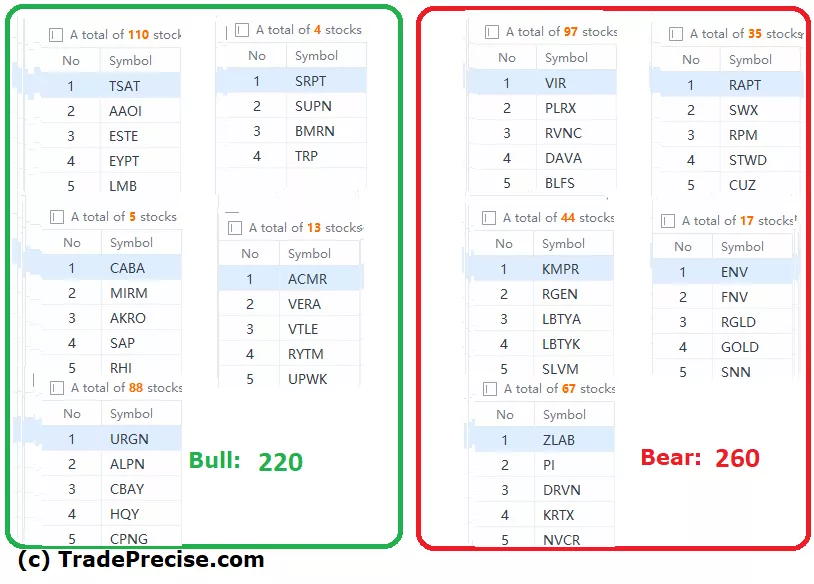
This is consistent with the reading from both the long-term and the short-term market breadth.
In the premium video, we discussed the 2 main types of trade entry setup between the outperforming stocks (mainly the newly added stocks) and the oversold stocks.
Both contain valid types of entry at the key support/pivot level. Yet the anticipated trend could be very different and how we could do in our trading plan if we decide to go for the entry.
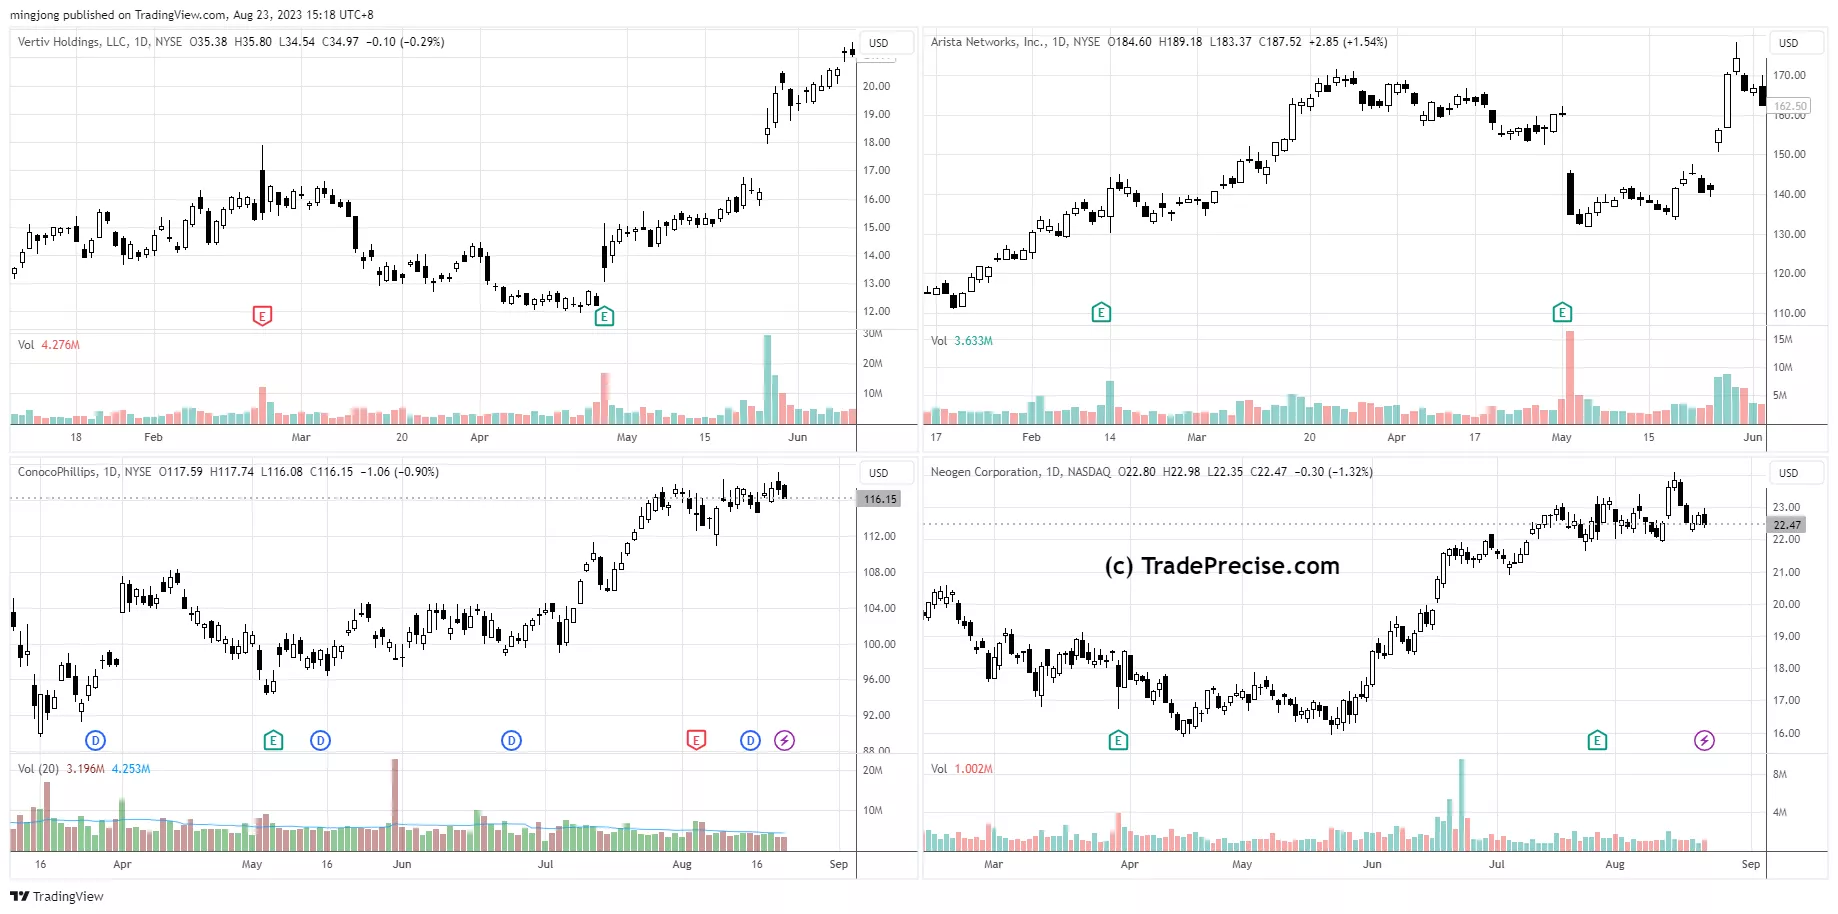
12 “low hanging fruits” (VRT, COP, etc…) trade entries setup + 16 others (ANET, NEOG, etc…) plus 7 “wait and hold” candidates are discussed in the video (43:51) accessed by subscribing members below.
(Click on image to enlarge)
A market correction is the best time for us to spot the resilient and outperforming stocks. When the tide turns, they will be the ones to rally first while continuing to beat the market.
More By This Author:
Is It Time For Bargain Hunting To Bet On A Relief Rally?
Is The Pullback Behind Us Or Still Looming? Let's Investigate
Beware! Red Flags In The Market


Comments
Log in or sign up to join the conversation.