
From last month’s record highs, both the S&P 500 and Nasdaq 100 are down just under three percent and have now approached the 50-day, which has not been lost since last October when they bottomed. Given that the trendline support from the October lows has now been breached, bulls understand the significance of the need to save the 50-day.
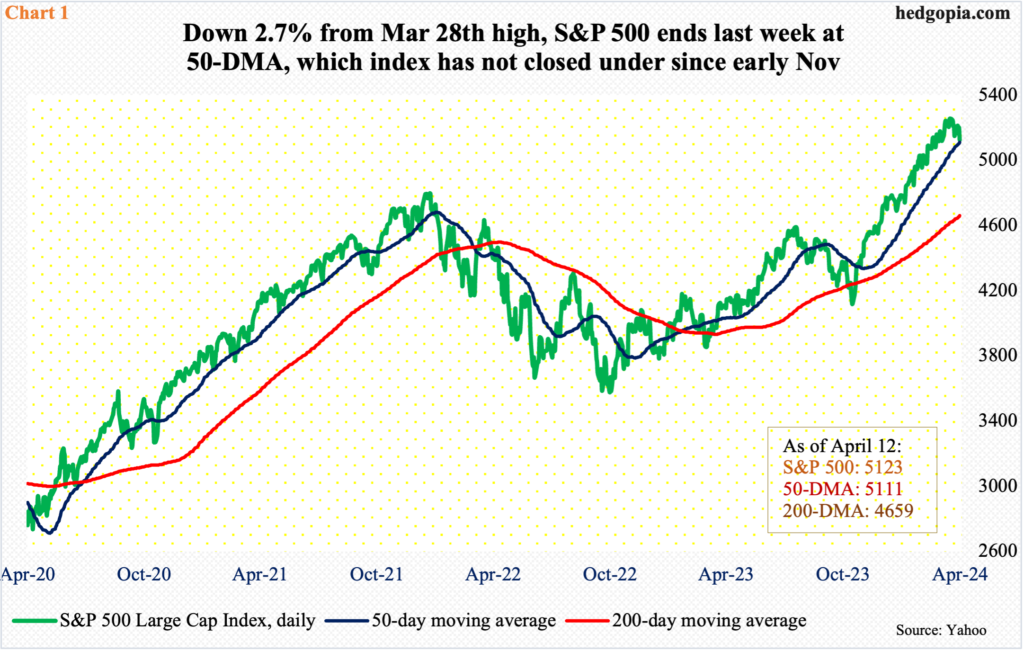
The S&P 500 has been under slight pressure since reaching a fresh high of 5265 on March 28th. This was followed by an intraday high of 5264 in the very next session (April 1st) and was preceded by 5261 on March 21st. Inability to push through 5260s has led to downward pressure. Through last Friday, the large cap index is down 2.7 percent from the March high – which is nothing in the big scheme of things.
From last October’s trough through last month’s high, the S&P 500 jumped 28.3 percent! The bullish momentum is at risk of cracking.
As the index pushed higher, the RSI began to diverge in March. Then came a breach of a rising trendline from last October. This was then followed by last week’s potentially bearish cross-down between the 10- and 20-day moving averages. With all this in the background, the index (5123) finished last week right on the 50-day (5111) – just about (Chart 1). It is a must-save for the bulls. In the event of a rally, their first test will occur at 5170s.
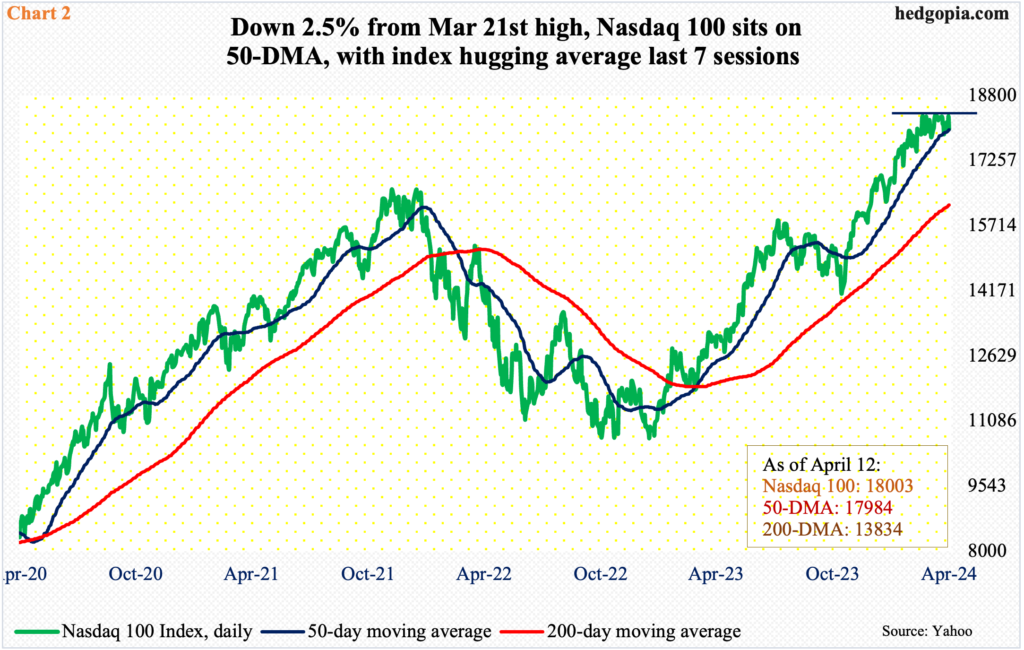
Things have evolved similarly on the Nasdaq 100, which surged 31.3 percent from the October low to then hit the wall early March, although it went on to post a new intraday high of 18465 on March 21st.
On the 1st last month, the tech-heavy index tagged 18333 intraday. Since then, 18300s have been touched several times, including last Thursday when the weekly high of 18337 was ticked. The index in essence has gone sideways since early March (Chart 2).
In the meantime, trendline support from last October has been compromised. Last week, the Nasdaq 100 (18003) essentially finished on the 50-day (17984). In fact, the index has essentially hugged the average last seven sessions. Inability to rally right off the average raises the risk that a breach is just a matter of time.
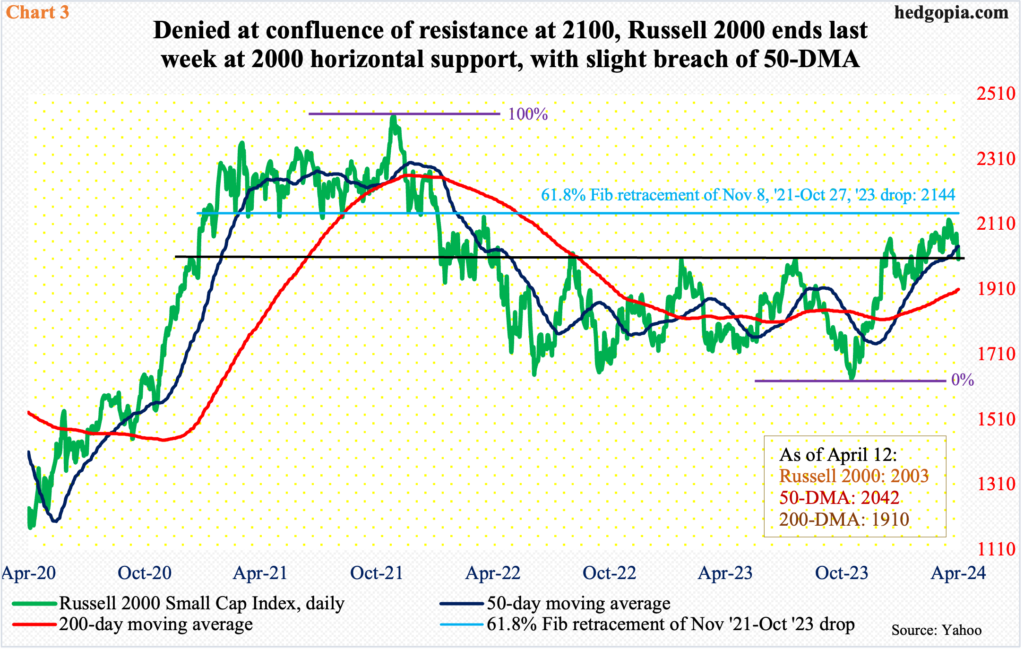
On the Russell 2000 (2003), the 50-day (2042) has been breached, albeit not by a whole lot. Unlike its large-cap cousins mentioned above, it never rallied to a new high post-October low.
The small cap index peaked in November 2021 at 2459. The subsequent drop bottomed next June at 1641, which was successfully tested that October at 1642. Then, last October, bulls once again showed up near those lows as the index ticked 1634 and turned up. The rally that followed stopped at 2135 on March 28th. After that, 2100-plus was hit twice more – and three times before that, with the first occurring on March 8th. This level is important from various angles.
A 61.8-percent Fibonacci retracement of the November 2021-October 2023 decline amounts to 2144 (Chart 3). It also represents a measured-move target of a range breakout that took place on December 13th; before that, it was rangebound between 1700-1900 going back to January 2022. As well, horizontal resistance at 2100 goes back to January 2021. The resistance has held.
Last week, the index closed essentially at 2000 lateral support, a breach of which will expose the index to breakout retest at 1900.
As things stand, be it small- or large-cap bulls, they are being forced to step up and show their mettle. Stocks have rallied huge since last October, and bearish sentiment is way suppressed. The major US tech outfits do not report until late this month and early next month. If to go by how last Friday’s bank earnings got treated, there will be tough sessions ahead in this earnings season.
More By This Author:
Commitment Of Traders On Futures, Hedge Fund Positions1Q24 Earnings Season Begins Amidst Collapse In Bearish Sentiment And More Or Less Sideways S&P 500
Unless Bond Bears Get Motivated By Budget Deficit/Federal Debt/Interest Payments, Bulls Could Find Rally In 10-Year Yields Tempting


Comments
Log in or sign up to join the conversation.