
Russell 2000 Index Elliott Wave Technical Analysis
Russell 2000 Elliott Wave Analysis – Trading Lounge Day Chart
Russell 2000 Elliott Wave Technical Overview
- Function: Bullish Trend
- Mode: Impulsive
- Structure: Orange Wave 1
- Position: Navy Blue Wave 1
- Next Lower Degree Direction: Orange Wave 2
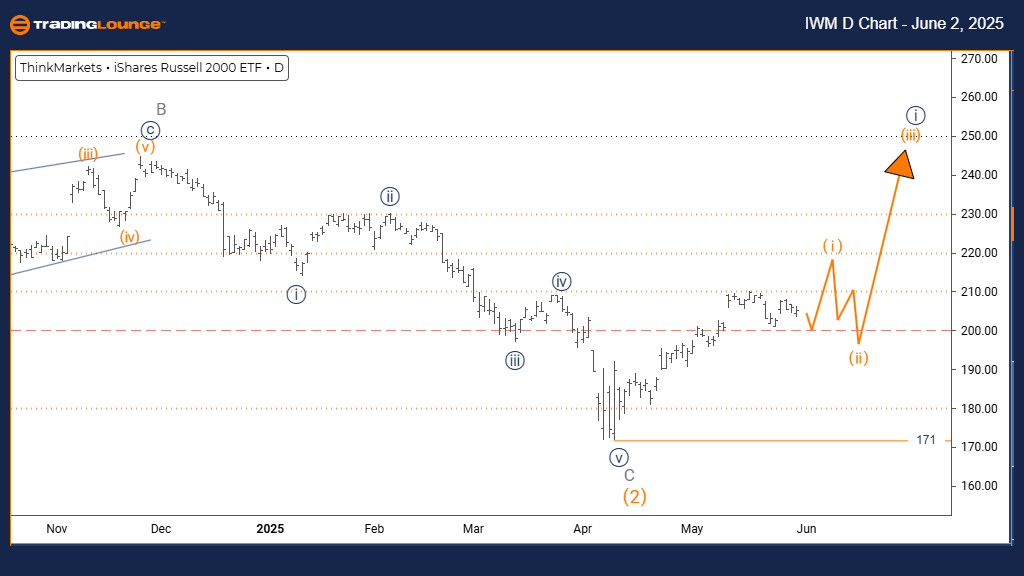
- Details: Orange wave 1 of navy blue wave 1 is active, signaling a fresh uptrend. Invalidation level: 171
Current Chart Outlook
The Russell 2000 index shows strong bullish momentum on the daily chart, suggesting the start of a new upward wave structure. Orange wave one is now forming as part of navy blue wave one, indicating the first leg of a broader bullish cycle. This implies the index may be in the early stages of a longer-term rally.
Market Dynamics and Risk
The impulsive characteristics of this wave show heavy buying interest. As long as the price remains above 171, the current wave structure remains valid. A drop below this level would challenge the bullish outlook and might suggest either a deeper correction or a re-evaluation of the wave count.
Forecast and Strategy Insights
With upward momentum in place, the index may continue rising until the completion of orange wave one. Afterward, traders should expect orange wave two as a retracement. The setup supports gains in the near term, but traders must manage risks carefully during this early phase of the trend.
Russell 2000 Elliott Wave Analysis – Trading Lounge Weekly Chart
Russell 2000 Elliott Wave Technical Overview
- Function: Bullish Trend
- Mode: Impulsive
- Structure: Navy Blue Wave 1
- Position: Gray Wave 1
- Next Lower Degree Direction: Navy Blue Wave 2
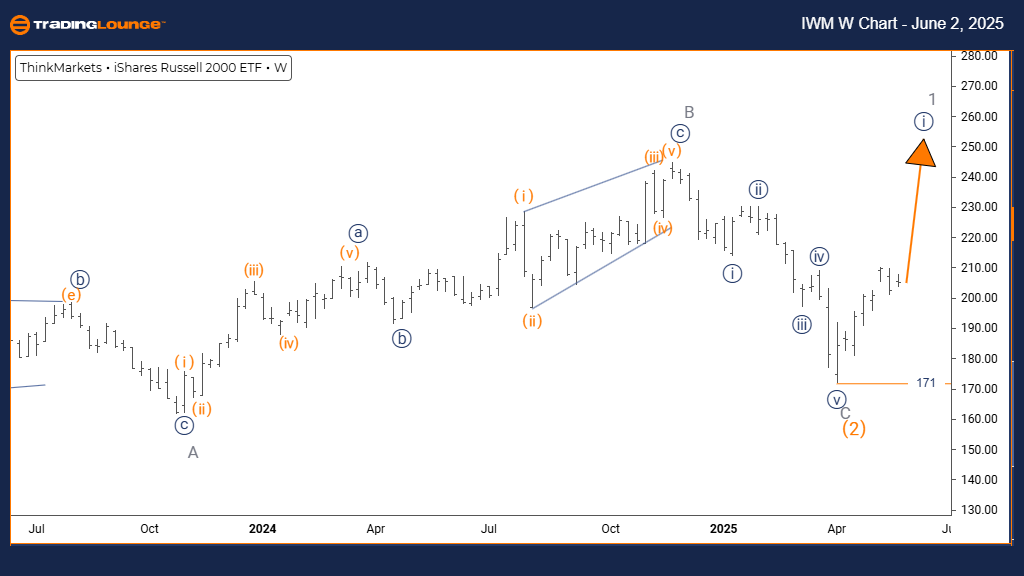
- Details: Orange wave two appears completed. Navy blue wave one of one is now in motion. Invalidation level: 171
Long-Term Market View
The weekly chart reflects a bullish breakout for the Russell 2000 index, with navy blue wave one unfolding within a broader structure marked as gray wave one. With orange wave two completed, the index seems to be initiating the first impulse wave of a longer bullish phase.
Implications for Investors
The impulsive characteristics and upward strength show solid buyer engagement. A key invalidation level lies at 171—if breached, a reevaluation of the current wave setup will be necessary. Until then, the bullish outlook remains intact.
Strategic Takeaways
This wave development suggests the index is at the beginning of a multi-phase upward trend. As navy blue wave one progresses, the next anticipated move is navy blue wave two—a corrective pullback. Investors should monitor continuation signals and support levels to optimize their entries and risk.
Technical Analyst: Malik Awais
More By This Author:
Elliott Wave Technical Analysis: British Pound/Australian Dollar - Monday, June 2
Elliott Wave Technical Analysis VeChain Crypto Price News
SP500, Nasdaq , Bitcoin & Top Tech Stocks Analysis
At TradingLounge™, we provide actionable Elliott Wave analysis across over 200 markets. Access live chat rooms, advanced AI & algorithmic charting tools, and curated trade ...
more

