

Image Source: Unsplash
Watch the video recording from the WLGC session to find out the following:
- What key price levels need to be broken for a real rally to 6,000?
- How to identify a true market rebound versus a weak rally that could fail.
- How the volume spikes signal potential trend shifts.
Video Length: 00:04:52
Market Environment
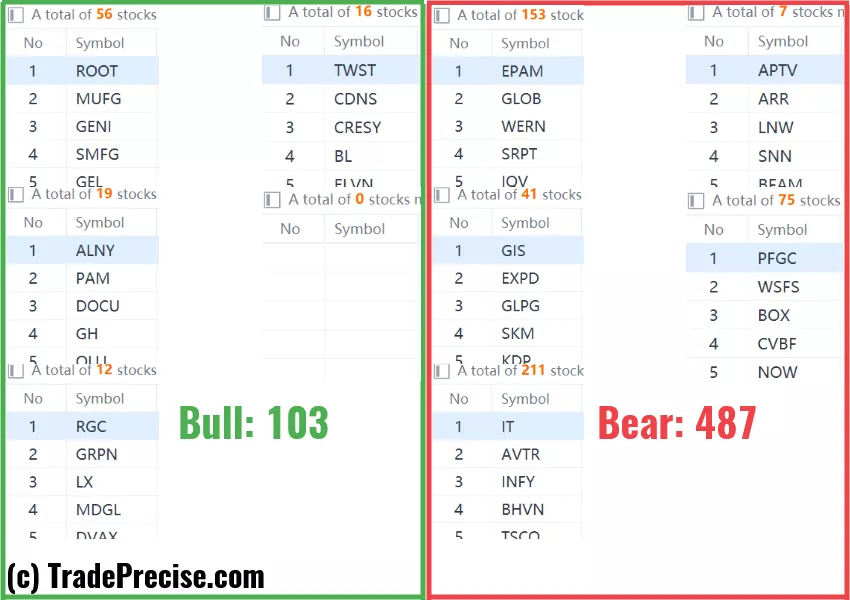
The bullish vs. bearish setup is 103 to 487 from the screenshot of my stock screener below.
(Click on image to enlarge)
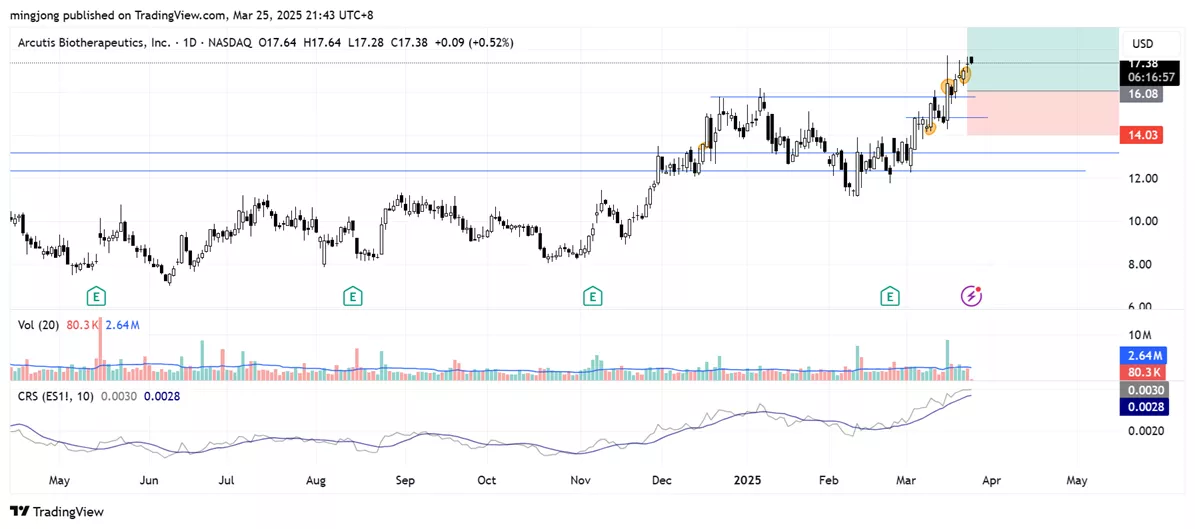
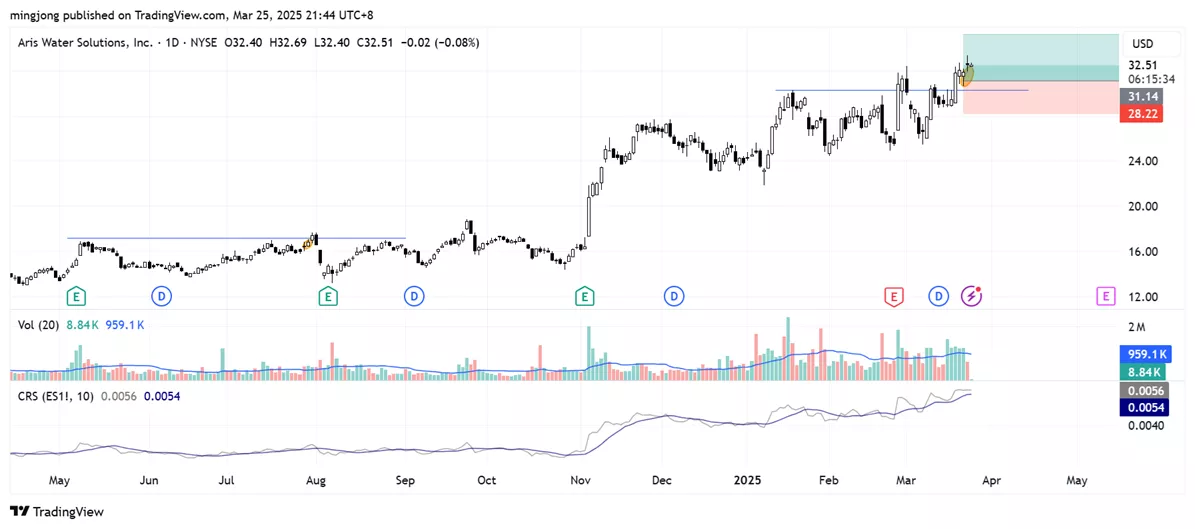
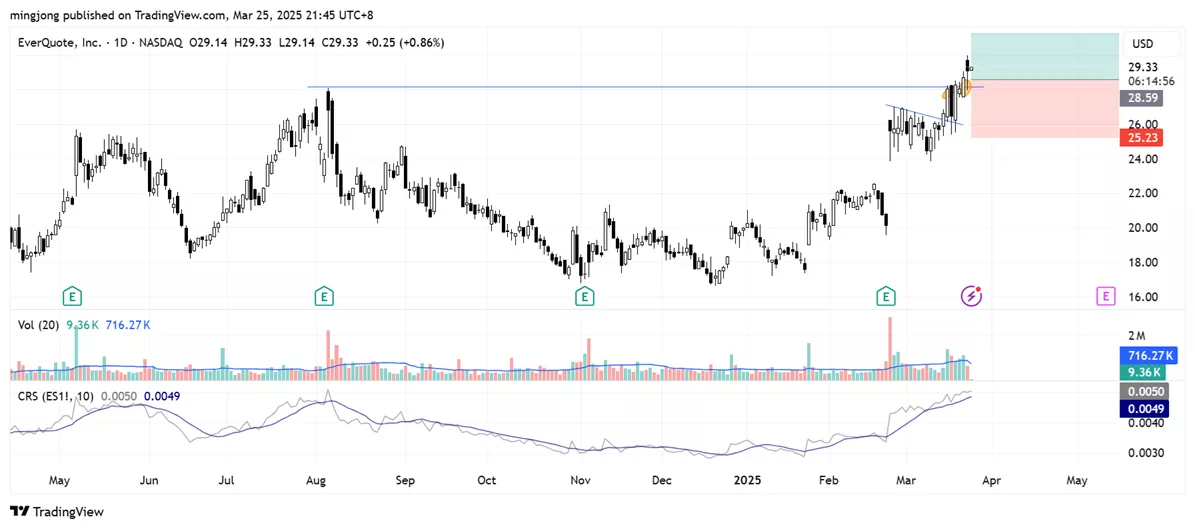
3 Stocks Ready To Soar
17 actionable setups such as ARQT, ARIS, EVER were discussed during the live session before the market open (BMO).
(Click on image to enlarge)
More By This Author:
Relief Rally As A Bull Trap? Bottoming Or More Weakness To Come?
Is This The Beginning? Insights On Bearish Distribution Patterns
Bearish Distribution Pattern Emerged In The S&P 500


Comments
Log in or sign up to join the conversation.