
Bearish Distribution Pattern Emerged In The S&P 500

Image Source: Unsplash
Watch the video from the WLGC session on 4 Mar 2025 to find out the following:
- The 2 bearish characteristics traders need to watch out for.
- The key differences between the first, second, and third segments in the S&P 500 structure.
- The key supports & resistance level in the S&P 500, Nasdaq 100, Dow Jones, and Russell 2000.
- and a lot more...
Video Length: 00:11:50
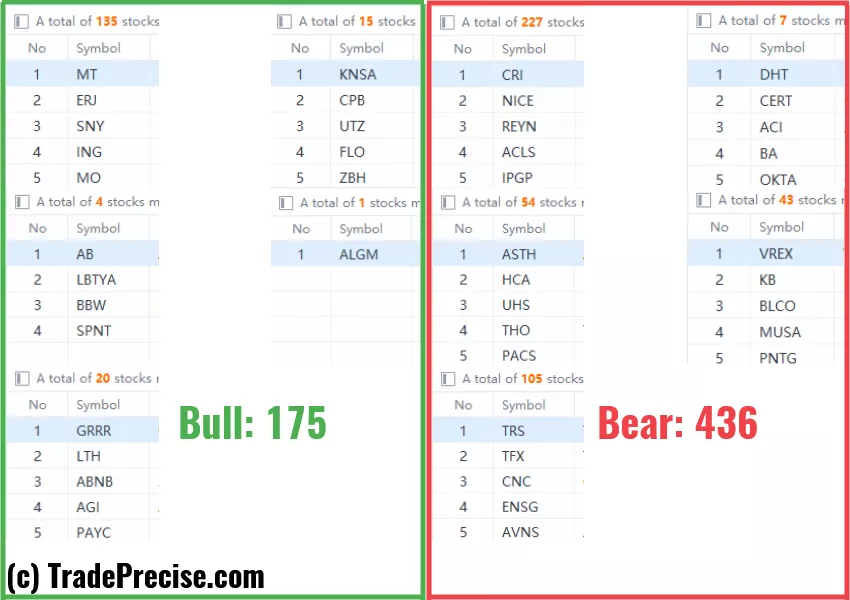
Market Environment
The bullish vs. bearish setup is 175 to 436 from the screenshot of my stock screener below.
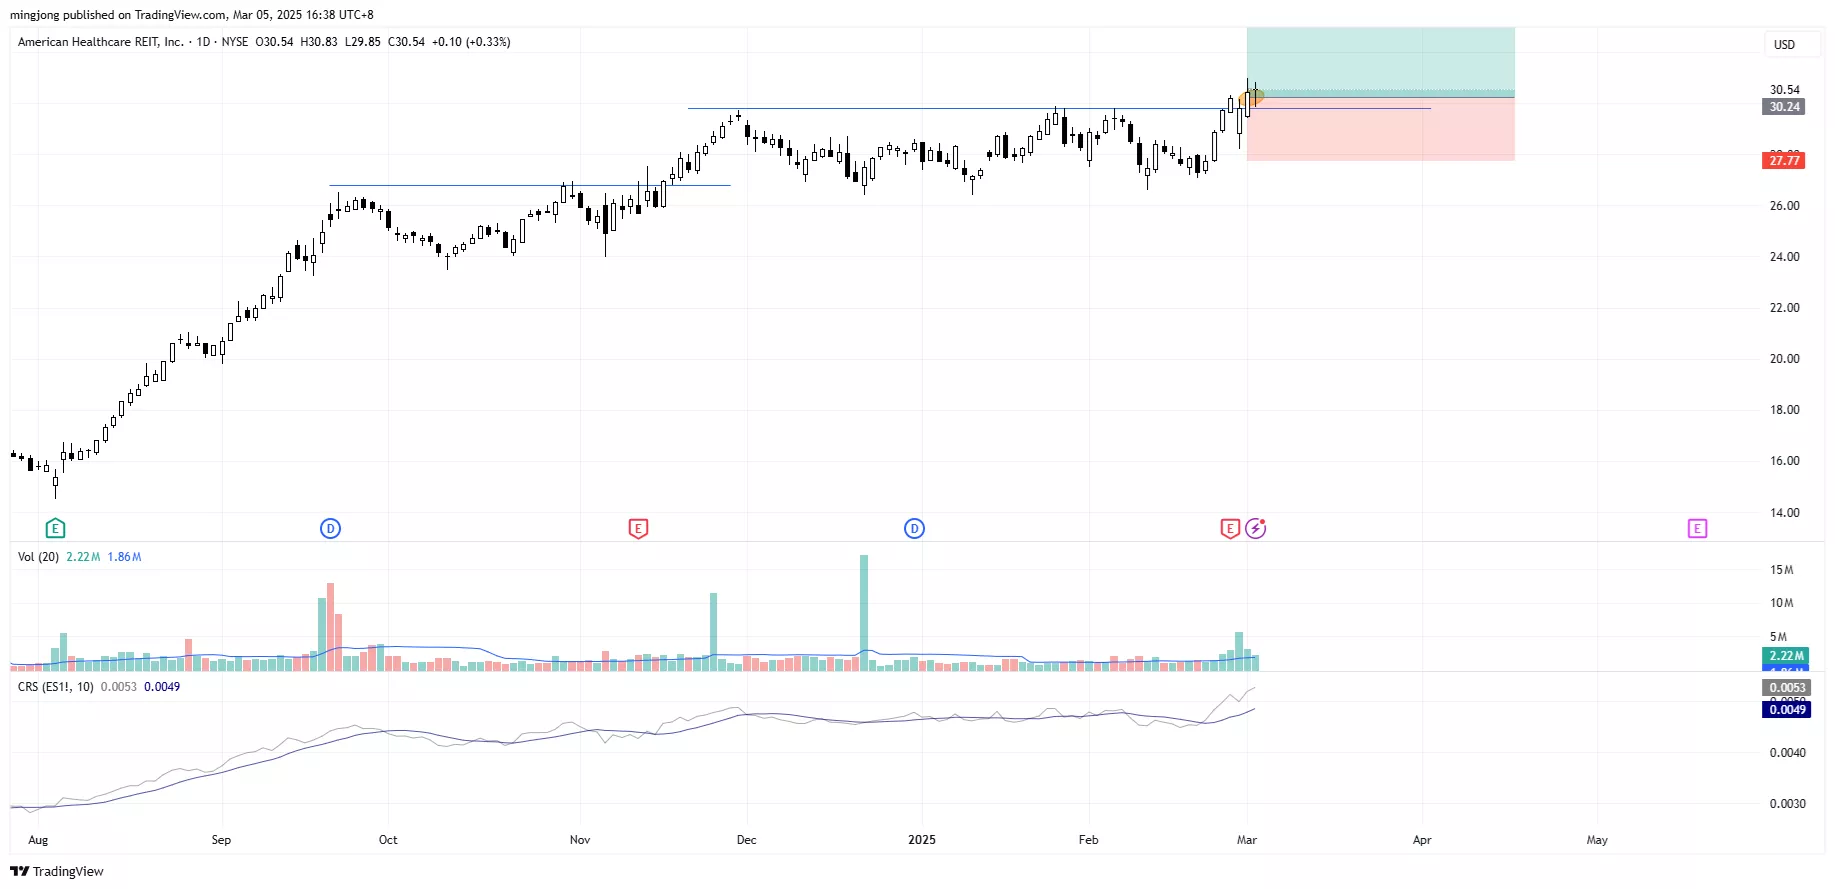
3 Stocks Ready To Soar
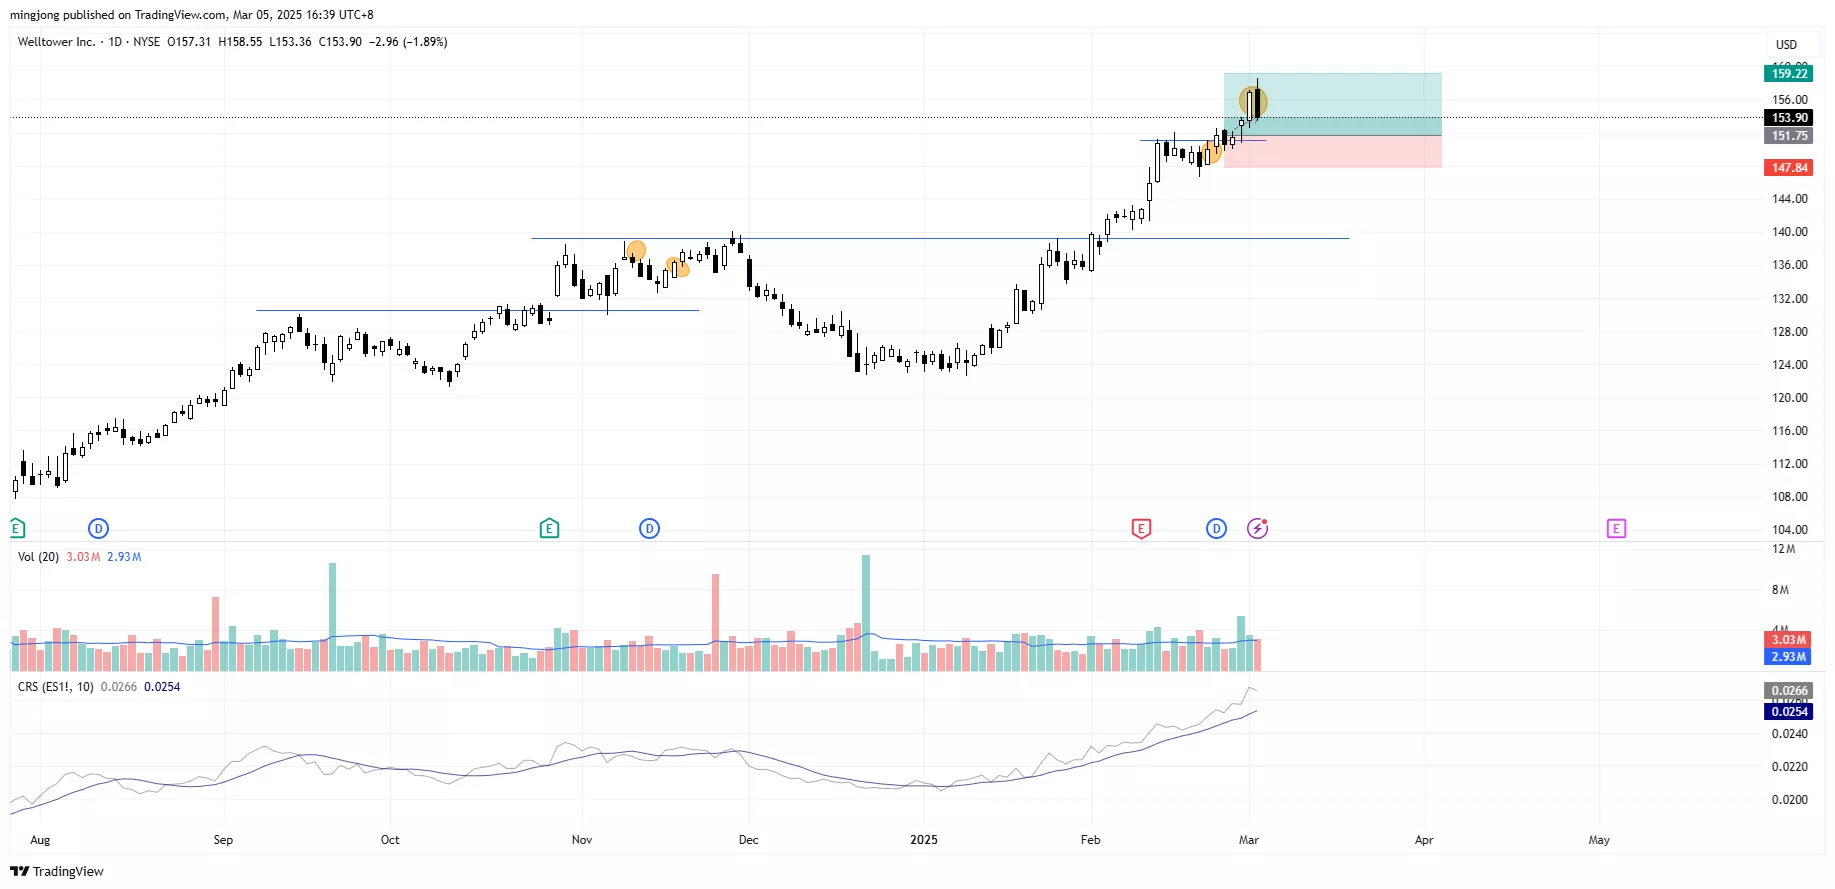
11 actionable setups such as AHR, WELL were discussed during the live session before the market open (BMO).
(Click on image to enlarge)
(Click on image to enlarge)
More By This Author:
Volatility Is Back: Buy The Dip?
This Key Signal Just Flashed In The S&P 500
Market Rally Or Collapse? This Chart Pattern Says It All
Disclaimer: The information in this presentation is solely for educational purpose and should not be taken as investment advice.
How did you like this article? Let us know so we can better customize your reading experience.

Comments
Leave a comment to automatically be entered into
our contest to win a free Echo Show.

