This Key Signal Just Flashed In The S&P 500

Image Source: Unsplash
Watch the video from the WLGC session on 18 Feb 2025 to find out the following:
- Why the latest resistance break in the S&P 500 could signal a bullish shift.
- The role of volatility contraction and what it means for future price action.
- How to spot individual stocks with strong relative strength that can outperform the market.
- and a lot more...
Video Length: 00:05:09
Market Environment
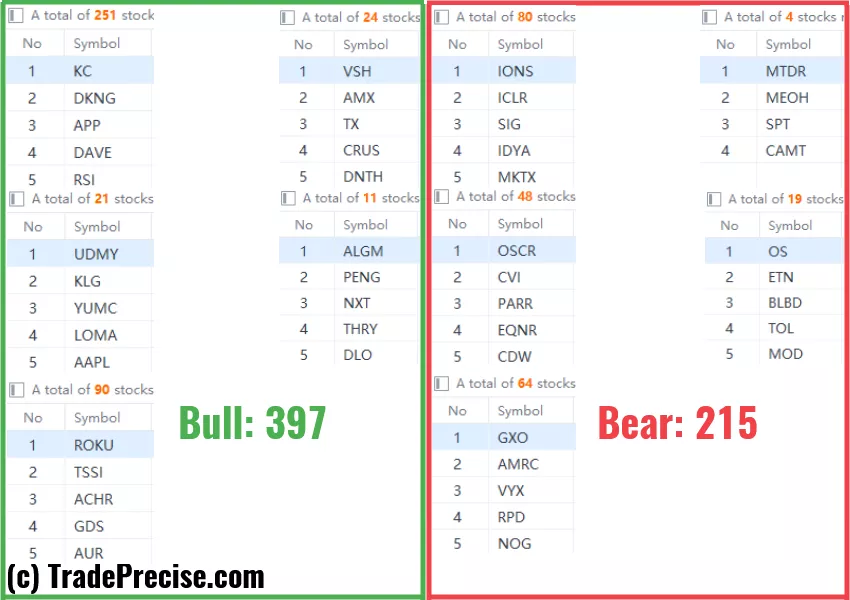
The bullish vs. bearish setup is 397 to 215 from the screenshot of my stock screener below.
3 Stocks Ready To Soar
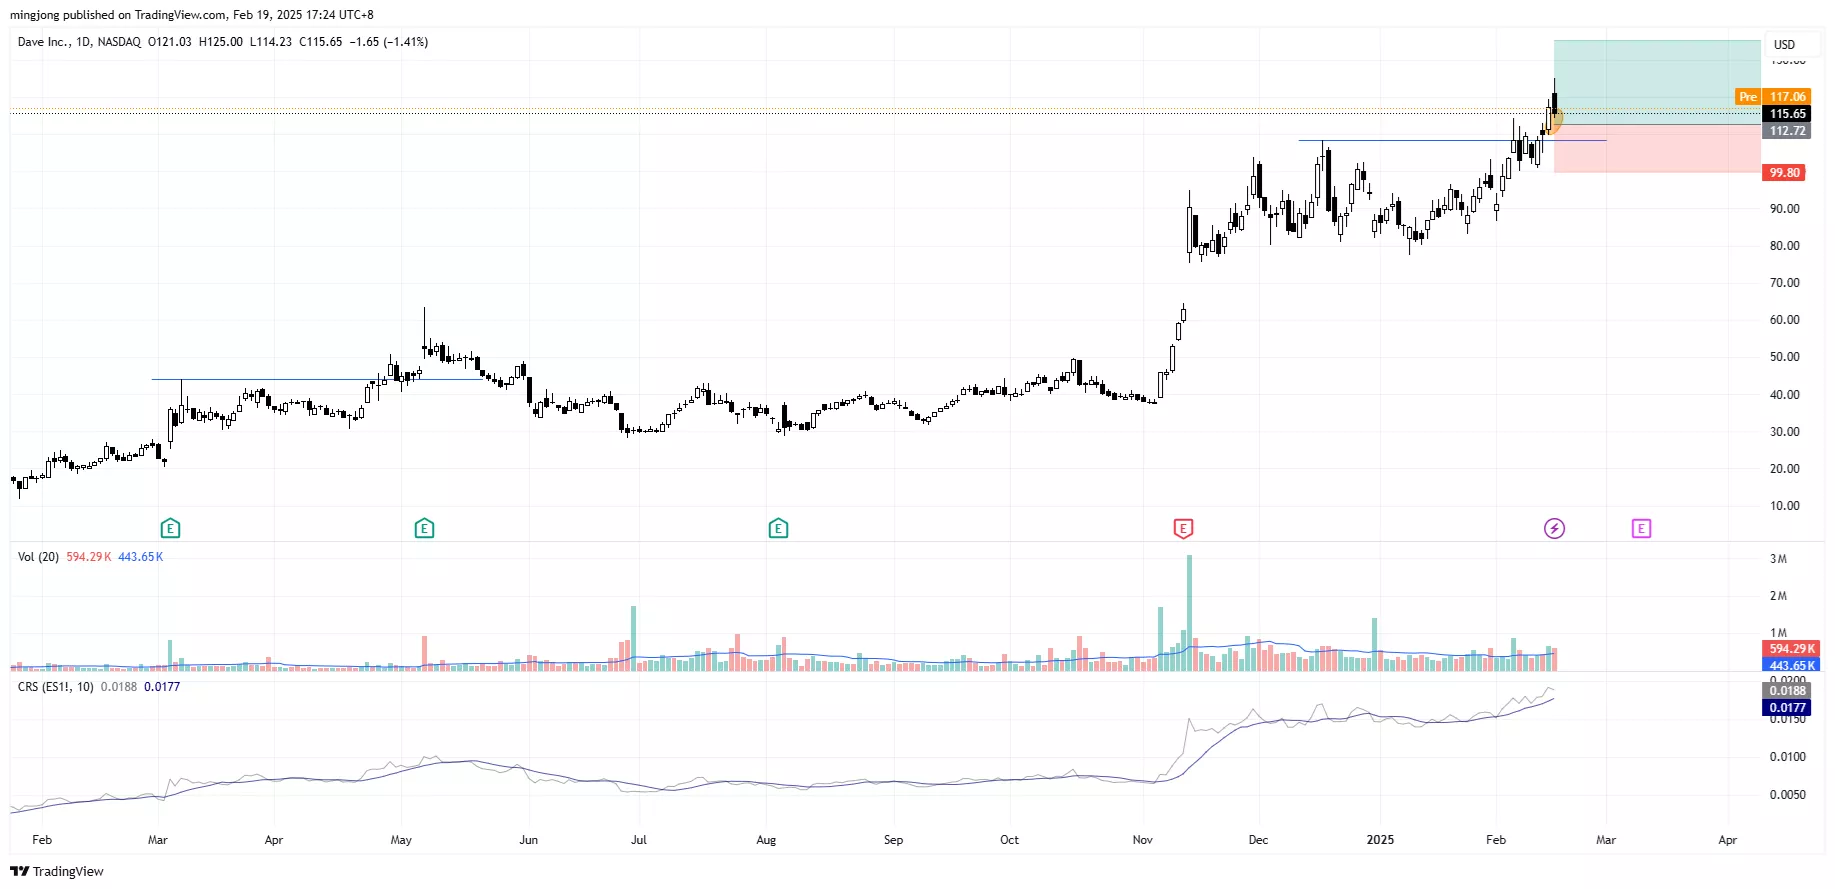
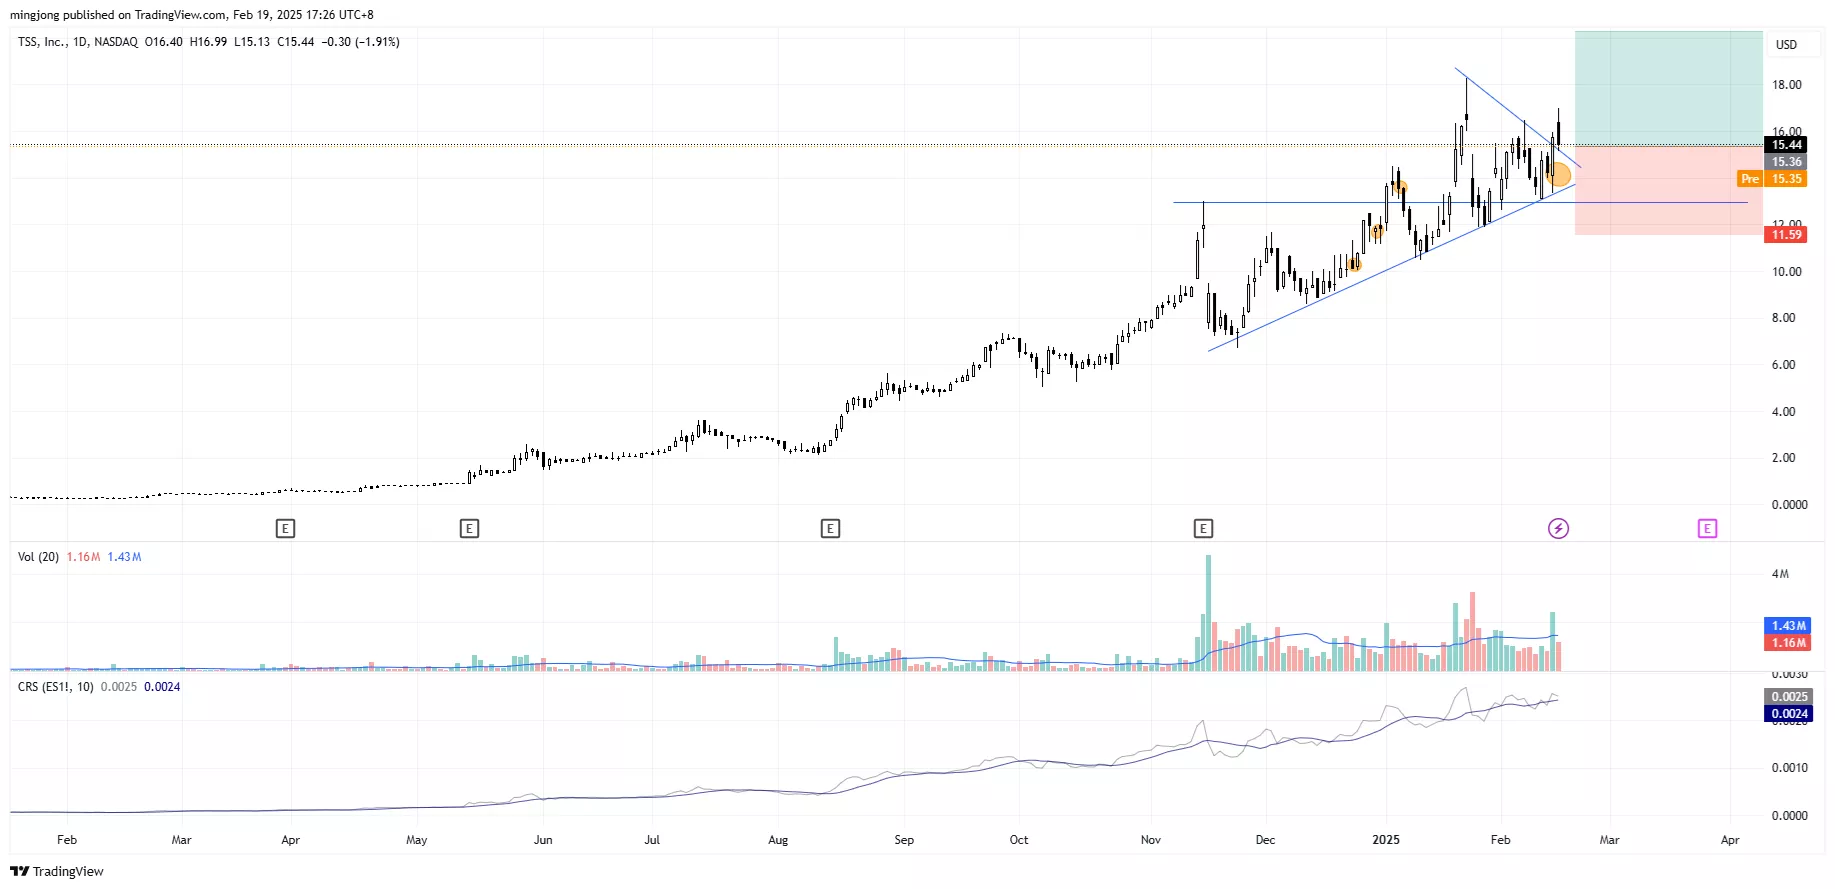
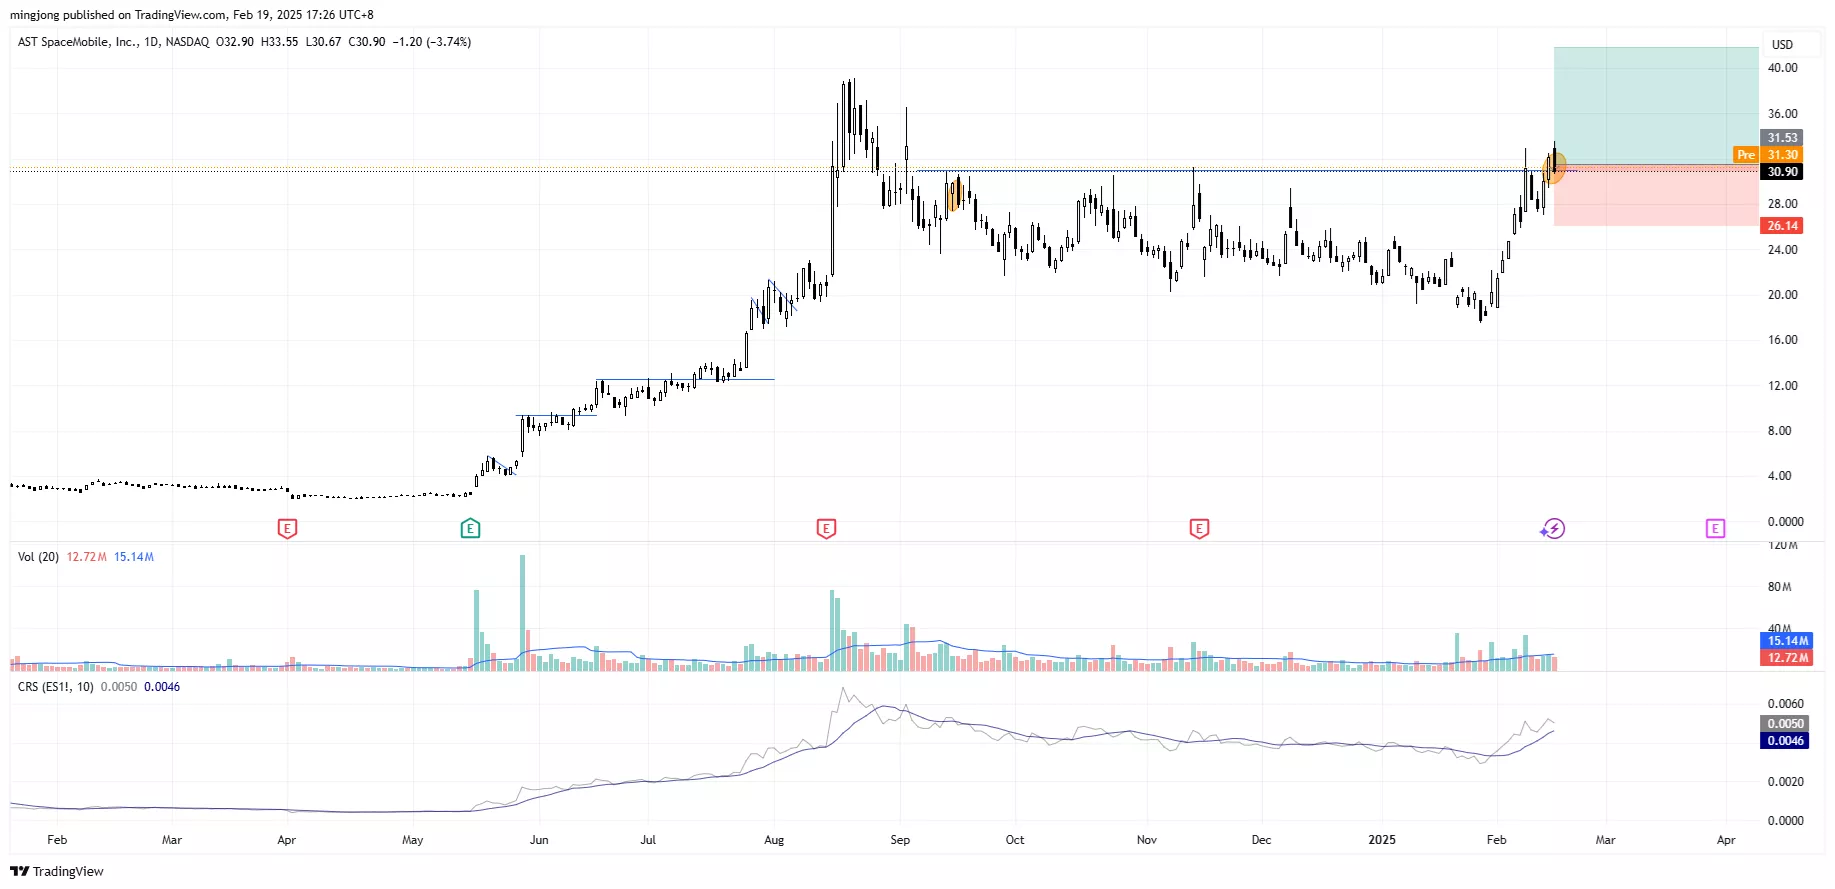
21 actionable setups such as DAVE, TSSI, ASTS were discussed during the live session before the market open (BMO).
(Click on image to enlarge)
(Click on image to enlarge)
(Click on image to enlarge)
More By This Author:
Market Rally Or Collapse? This Chart Pattern Says It All
S&P 500 Dodged Bearish Breakdown - All Eyes On This Key Resistance Level
Sharp Move Coming? Will This Bear Market Leading Indicator Work In 2025?
Disclaimer: The information in this presentation is solely for educational purpose and should not be taken as investment advice.


Both $ASTS and $DAVE in the same article? Bullish