
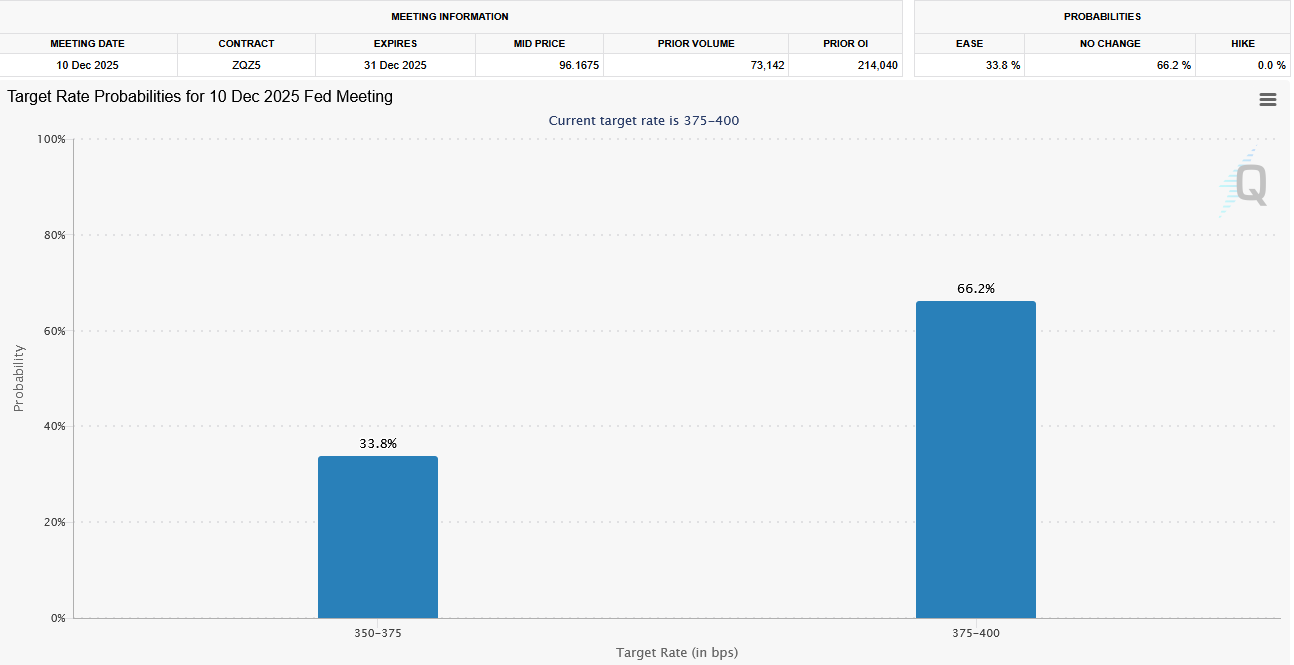
As we share below, the odds of a Fed Funds rate cut at the December FOMC meeting are down to 33%. On Wednesday, there was an abrupt repricing of rate cut odds after the BLS cancelled the October employment report and delayed the November data until December 19th. Furthermore, the BLS JOLTS report for September has been canceled, and the data for October will be released on December 9th. For reference, the FOMC meeting is on December 10th, so they will lack meaningful employment data when deciding whether to cut rates. The weakening labor market is the predominant reason the Fed cut rates by 25 bps at each of its last two meetings.
Despite the absence of recent employment data, Fed officials will argue that they can still assess the labor market using alternative data sources. Markets do not agree, as judged by the downgrade in rate-cutting odds. For what it’s worth, the last two weekly ADP employment change reports show a decline of 11,250 jobs in the last week of October, and another loss of 2,500 jobs in the first week of November.
In other Fed news, the minutes from the FOMC’s October meeting, released on Wednesday, show a deep divide over whether to cut interest rates at the December meeting. Several officials noted that progress in lowering inflation has “stalled” and cautioned that further rate cuts could risk entrenching higher inflation and undermining the Fed’s credibility regarding its 2% inflation target. However, another group argued that further cuts are necessary to guard against rising unemployment and some signs of weakening economic growth. Per the minutes:
“Participants generally judged that upside risks to inflation remained elevated and that downside risks to employment were elevated and had increased since the first half of the year.”
What To Watch Today
Earnings
(Click on image to enlarge)

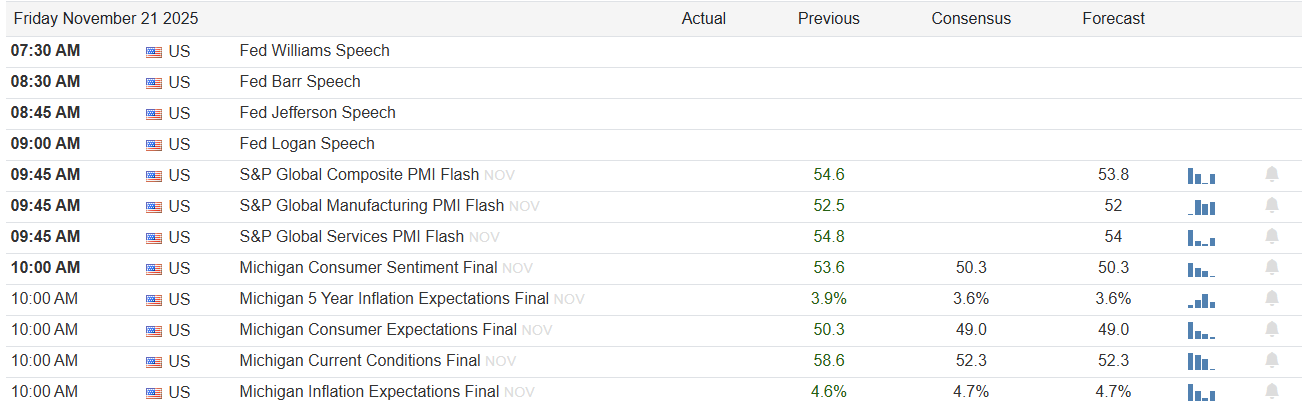
Economy
(Click on image to enlarge)
Market Trading Update
Yesterday, we discussed the recent pressure on Bitcoin and cryptocurrencies in general. As noted below, Nvidia’s earnings report alleviated some of the recent concerns about earnings strength, but the market remained under pressure from recent selling heading into options expiration today. Much of the recent selling pressure has been a result of derisking portfolios ahead of Nvidia’s earnings and options expiration, which will likely drive the market next week. This will lead to a stronger performance period from the end of November to the first week of December. As Sentiment Trader noted yesterday:
“The chart below displays the hypothetical growth of $1 invested in the S&P 500 Index only during this nine-trading-day period every year starting in 1951.”
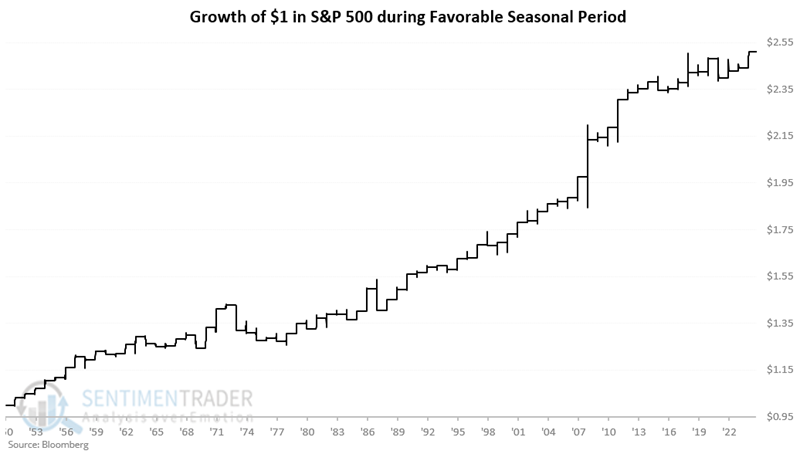
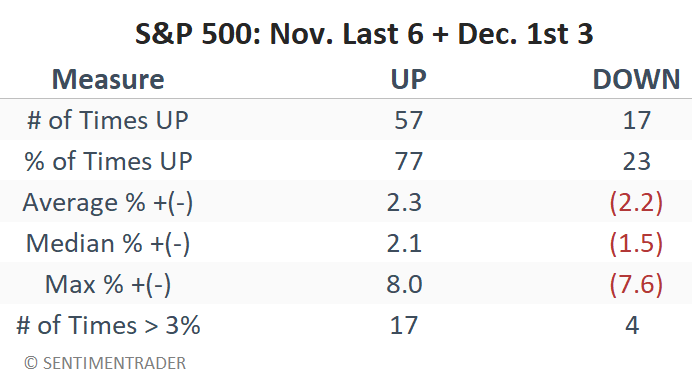
Of course, not every year was a winner, but statistically, that market performs better on average, suggesting that investors should remain exposed to equity markets. In 24 of the last 26 years, and 33 of the previous 37, the S&P 500 gained ground during the upcoming period. Again, while not a “perfect” track record, the odds seem tilted in favor of investors.
Combining those historical statistics with the technical backdrop suggests better odds also. The market is oversold on a short-term basis and continues to test recent support at the 100-day moving average. With money flows having weakened, there is now a good setup for buyers to re-enter the market heading into the year-end reporting season. While there will likely be some volatility in the second week of December as mutual funds make their annual distributions, the setup for the traditional “Santa Claus Rally” seems intact.

If the recent correction has been painful, use any rally over the next two weeks to rebalance your portfolio’s risk. While we are more bullish heading into year-end, the outlook for next year becomes much more cloudy with a chance of rain.
Nvidia Hits Another Home Run
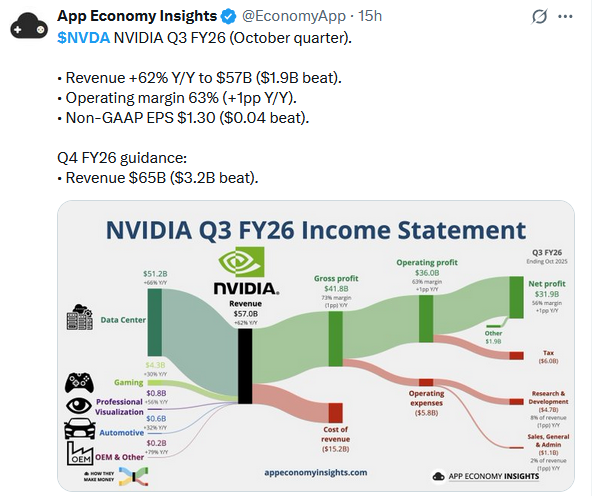
Once again, Nvidia reported stellar quarterly earnings. For the third quarter, the company reported revenue of $57.0 billion, surpassing analyst expectations of $55.4 billion. The increase represents a 62% year-over-year rise and a 22% increase compared to the prior quarter. Not surprisingly, their data center segment accounted for a significant portion of the revenue ($51.2 billion). Adjusted earnings per diluted share came in at $1.30, beating Wall Street’s $1.26 forecast. Per Nvidia’s CEO Jensen Huang,
Blackwell sales are off the charts, and cloud GPUs are sold out. Compute demand keeps accelerating and compounding across training and inference — each growing exponentially. AI is going everywhere, doing everything, all at once.
It’s not just the sales and earnings growth that make Nvidia’s story bullish; its gross margins were little changed at a whopping 73.4% on a GAAP basis. Furthermore, as in prior reports, they continue to provide forecasts that exceed Wall Street’s expectations. The initial market reaction was positive, with the stock gaining about 5%.

The screenshot below, courtesy of FinViz, shows that with the new earnings data, Nvidia has a PEG ratio of 1.10. That is cheaper than the S&P 500 and well below some of its technology-sector competitors. The PEG ratio below assumes a P/E ratio of 48 and a five-year future EPS growth rate of 44%. While such growth is a tall order, it is a good bit slower than their 65% EPS growth over the last year. This leaves us with two questions to ponder:
- Is Nvidia’s earnings report enough to alleviate recent fears of a bubble in the AI industry?
- Might Nvidia be a value stock?

Nvidia: The Bearish Take
The prior section spoke highly of Nvidia’s earnings announcement. We thought it would also be helpful to point out some aspects of the report that some claim are not so positive.
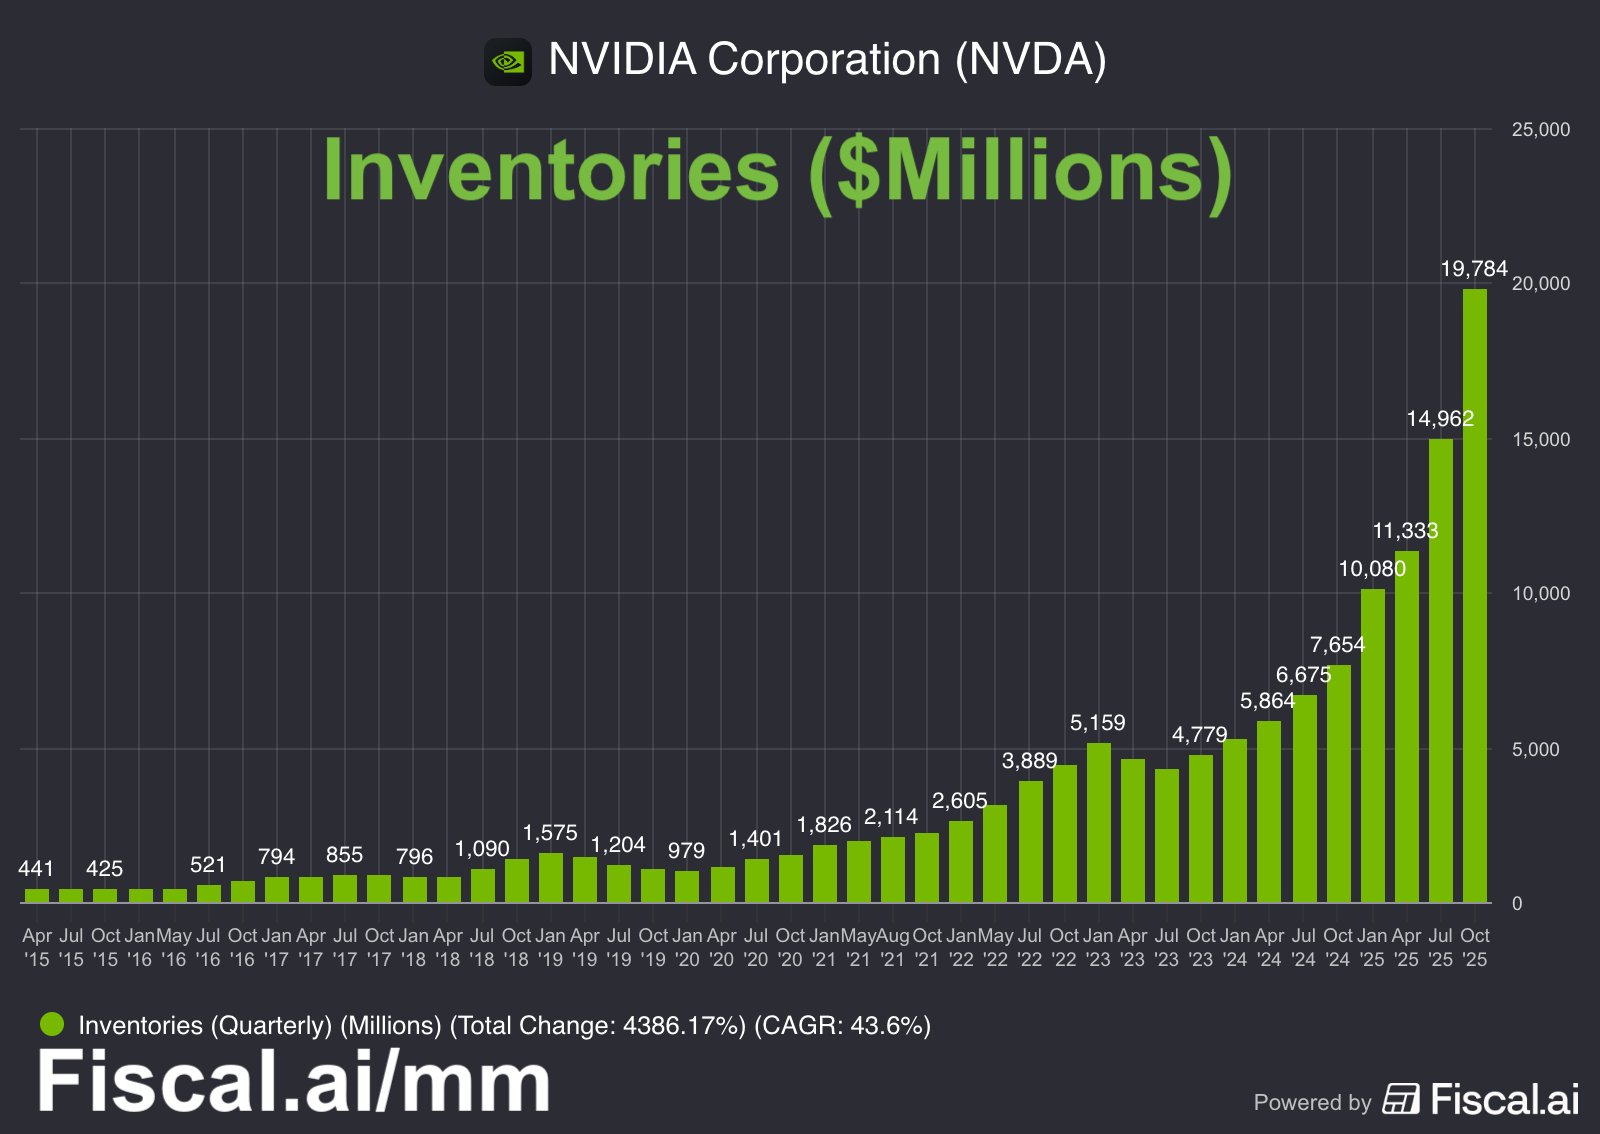
- The first graph below shows that inventories are up 32% quarter over quarter. If their GPUs are sold out, why is the inventory increasing rapidly?
- Accounts Receivable grew by $5.58B in the last quarter. Take away growth in accounts receivable and revenue missed expectations by $3.49 billion.
- A significant discrepancy between the net income declared of nearly $32B and the operating cash flow of $24B. Some claim this is due to creative accounting.
- The second graphic below is a tweet from Michael Burry. He has recently claimed that companies are using depreciation schedules for Nvidia chips that exceed the chips’ useful lives. Doing so props up earnings by reducing expenses. Accordingly, better-perceived financial health allows companies to finance CAPEX, which ultimately flows to Nvidia.

Tweet of the Day
More By This Author:
Oracle And CoreWeave CDS Spreads Widening: Omen Or JittersMargin Debt Sets Records: Should We Be Concerned?
Apple Out Google In: Warren Buffett’s Latest Moves


Comments
Log in or sign up to join the conversation.