
Fear is being spread on social media that some AI players are nearing default. The evidence, some say, lies in the Bloomberg graphs below showing the widening CDS spreads of Oracle and CoreWeave. Before getting into some details about what the CDS markets may be warning about Oracle and CoreWeave, let’s explain what CDS is.
CDS stands for credit default swaps. These are derivative contracts in which one party, the default protection buyer, pays a quarterly fee, expressed in basis points. In return, the counterparty, or protection provider, assures that in the event of default, the buyer will receive par for their bonds. CDS spreads, or the cost of default insurance, provide the market with an easy way to quantify the implied market default probability. While simplified, here is the math to calculate default risk:
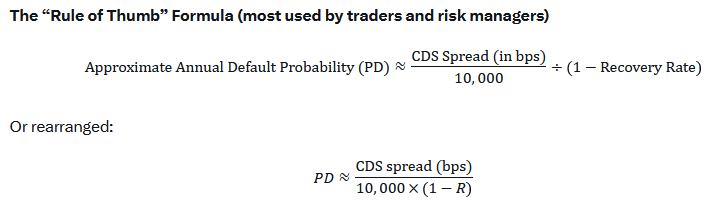
Essentially, the formula divides the cost of insurance by the bonds par value less the recovery rate. The recovery rate represents what bond holders will recover in event of default. Often, the market assumes 30 to 40 cents on the dollar.
Applying this math to five year Oracle and CoreWeave CDS spreads, and assuming a 35% default recovery, we get the following annual default probabilities.
Oracle CDS 108 bps: 108 / (10,000*(1-0.35)) = 1.66%
CoreWeave CDS 675 bps: 675 / (10,000*(1-0.35)) = 10.38%
We can then cumulate the annual probabilities above to determine the market implied odds that Oracle or CoreWeave default over the next five years. Currently, those odds stand at 8% for Oracle and 42% for CoreWeave. Further below in this Commentary we discuss why the market is assigning a sizeable default probabity for CoreWeave.

What To Watch Today
Earnings
(Click on image to enlarge)

Economy
(Click on image to enlarge)

Market Trading Update
Bitcoin and the broader cryptocurrency market have experienced a sharp selloff over recent weeks, driven by a combination of structural shifts, macroeconomic pressures, and deteriorating technical conditions. Bitcoin has retraced much of its October rally, and the total cryptocurrency market capitalization has dropped by approximately 25%, wiping out nearly $1 trillion in value. This decline has not been isolated. Major investment vehicles, including the iShares Bitcoin Trust (IBIT), have seen record outflows, signaling a broad retreat by institutional investors.

One of the key drivers of this correction is excessive leverage. Many traders used borrowed capital to amplify returns during the uptrend. As prices began to decline, these positions were liquidated automatically, accelerating the downward momentum. Most notably, while retail investors have long begged for ETFs to be launched, those ETFs now provide institutions with an easy way to short and hedge their books, adding to downside pressures when corrections occur. Lastly, the fact that crypto markets still suffer from relatively thin liquidity means large trades have an outsized impact on prices, especially during periods of stress.
At the same time, risk sentiment across global markets has shifted. Cryptocurrencies continue to behave like high-beta assets. When equities weaken or macroeconomic uncertainty rises, crypto tends to follow. The correlation between Bitcoin and the Nasdaq 100 remains very high.

Adding further pressure, the structural buyers who had supported the market during the rally have become net sellers. This includes institutional funds and ETFs that previously provided a reliable source of demand. As noted, these large players not only have started to unwind positions, in the absence of steady inflows, they are also capitalizing on the downturn by shorting the market. This turns the current environment into a more structural headwind.
Technically, the selloff has broken several key support levels, all major moving averages, and has triggered a “death cross” with the 50-day moving average crossing below the 200-day moving average. That technical breakdown triggered a risk reduction among traders, reinforcing the decline and eroding confidence in smaller-cap altcoins, which are falling faster than Bitcoin. The good news is that Bitcoin is deeply oversold and due for a reasonably significant bounce that can be used to rebalance positioning.

Crypto markets are now more sensitive to macroeconomic data, ETF flows, and liquidity dynamics, and remain substantially more volatile than the equity market itself. If institutional outflows persist and central banks remain hawkish, the selling pressure may continue. So it’s worth paying attention to the broader backdrop.
What this selloff does reinforce is the need to manage exposure risk. When markets are rising, we all think that we are smarter than we really are. The correction was inevitable and will eventually provide a good entry point for patient investors. It also highlights the importance of understanding when to reduce risk and take profits. Crypto remains a speculative asset class; understand the drivers of this selloff, set realistic expectations, and manage portfolio risk effectively.
What’s Irking CoreWeave Investors
As we shared above CoreWeave’s CDS is pricing in a moderate chance of a failure. Why? The quick answer is that the company, offering cloud computing services, is highly levered and spending significantly to build out its products. Additionaly, despite rapidly growing revenue, it is losing money and bleeding cash. To add to concerns, they are extremely dependent on Nvidia to get an appropriate allocation of chips. Lastly, their ability to offer its clients and potential clients its products is heavily dependent on the electrical grid, which is constrained.
To raise capital recently, the company is using Nvidia chips as collateral. That collateral may be worth a lot today, but due to rapidly changing technology cycles, it may be outdated and worth a lot less tomorrow. Further, prices could fall rapidly on said chips, requiring CoreWeave to post more collateral.
The screen shot below, courtesy of Refinitiv, shows that CoreWeave has $18.6 billion of debt outstanding, spread out between bonds and loans. Over the last four quarters the company has sales of $1.92 billion but it has a net loss of nearly $1.5 billion over the same period. Those buying protection are clearly worried that CoreWeave can not ramp up sales quick enough and or find enough new financing to make payments to meet their current obligations and additional capital to offset their losses. The bet by those selling CDS insurance is that its revenues and income rise rapidly to improve its financial situation.

How The Fed Deals Liquidity: The Monetary Toolbox
In our last article, QE Is Coming, we focused on why the capital and financial markets have become so dependent on the Fed for liquidity. The article explains that, in the aftermath of the crisis, a slew of regulations drastically changed the liquidity landscape. As a result, the Fed—not the private market—is now the primary provider of liquidity.
A reader asked us the following:
“Can you provide a list and description of the liquidity tools in the Fed’s toolbox?”
We like the idea. Given the importance of liquidity to financial market performance, it is crucial to understand not only who supplies liquidity but also how they do so.
Let’s walk through the Fed’s balance sheet and gain a better appreciation for its toolbox.

Tweet of the Day

More By This Author:
Margin Debt Sets Records: Should We Be Concerned?Apple Out Google In: Warren Buffett’s Latest Moves
Full Market Cycles: Half Bull And Half Bear


Comments
Log in or sign up to join the conversation.