
Private Credit Funds Falling Out Of Favor
Private credit funds were all the rage in 2024 and 2025 as institutional and high-net-worth retail investors sought more risk and higher returns. Over the last few months, that trend has started reversing. The FT reports that private credit investors pulled more than $7 billion from some of the biggest private credit funds in the fourth quarter. While sizable, the amount withdrawn is small compared to the estimated $2.5 billion in the private credit industry, of which private credit funds account for over $500 billion. The graphic below, courtesy of the FT, shows the pickup in private credit fund redemption requests.
Investors’ concern was initially sparked by the Tricolor and First Brands bankruptcies in September 2025. Adding to their worries, Fed rate cuts are reducing the appeal of floating-rate debt, which underpins many private credit loans. Despite the two headline defaults, there are a few signs of deteriorating credit quality. To wit, we share a few quotes from the FT article below. Bear in mind that the quotes are from managers who profit by growing their private credit funds.
Ares in December told clients in its fund that its investments remained “healthy” and that it would commit to maintaining its dividend through June.
Blackstone said that “investors continue to recognise the premium private credit can offer versus public fixed income”.
Cliffwater’s Hasbrouck said the firm was “not worried about our ability to perform, knowing that we have a lot of liquidity behind us and we think quarter on quarter things will get better.”
It’s also worth adding that banking liquidity showed some signs of stress in the fourth quarter. As a result, the Fed halted QT in October 2025 and started QE in December. The reversal in policy is meant to address liquidity concerns sparked by numerous instances of irregular overnight borrowing interest rates. Riskier credits, such as private credit funds, provide a good gauge of the market’s risk tolerance and liquidity. If the current trends persist in 2026, these redemptions may be an early warning sign of broader liquidity, financial, and economic weakness.

What To Watch Today
Earnings
(Click on image to enlarge)

Economy
(Click on image to enlarge)

Market Trading Update
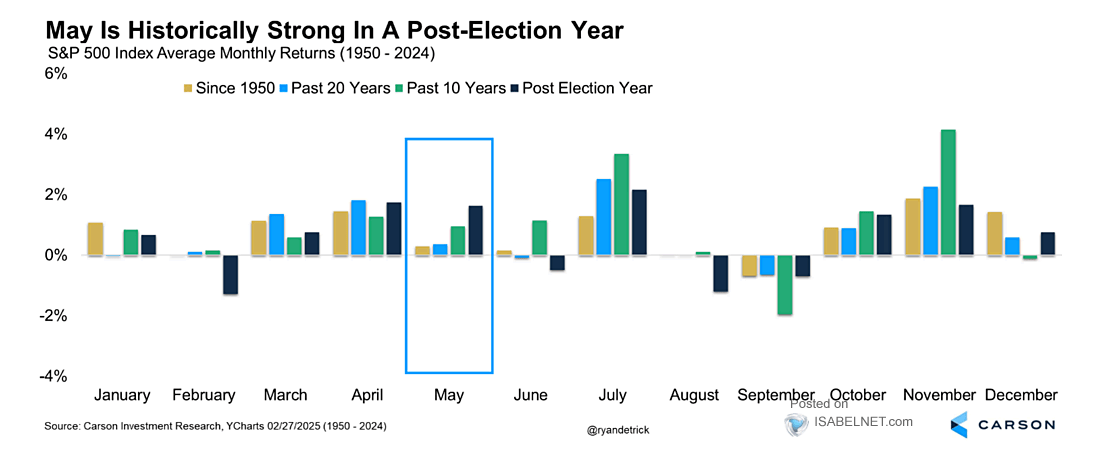
Yesterday, we reviewed the technical backdrop of the market. However, this is also the beginning of a new month, which happens to be one of the weaker months of the year. From a seasonality perspective, the month of February tends to have lower returns than other months of the seasonally strong period, and has about a 50/50 win rate.
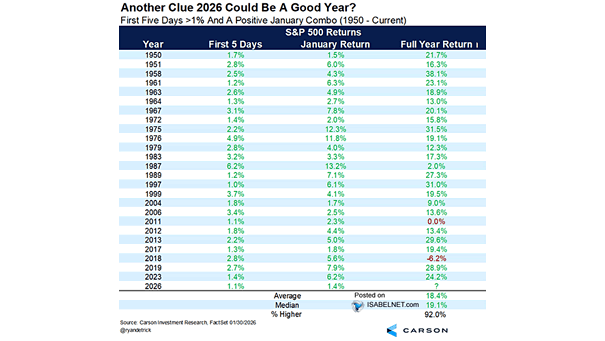
The good news is that both the first 5 days of January and the entire month were positive, which bodes well for full-year returns. When the S&P 500 rises more than 1% in the first five days, and January closes in the green, the market has finished the year higher 92% of the time, with a median 19.1% gain since 1950.
(Click on image to enlarge)
While the data suggests that any near-term weakness will likely be temporary, given the more significant deviations from long-term means, those corrections could be larger. As such, it will likely pay to manage risk more closely. Precious metals investors learned the meaning of “risk” on Friday. The irony is that the rational for owning metals was to get out of the stock market because it was going to crash.
That may be true. However, the stock market doesn’t crash by 30% in a day. Silver did.
The lesson is to manage your risk, don’t get overextended, and control your leverage. The goal is not to get rich quickly; it is to survive the long game.
Staples Assent While Materials & Industrials Fade
Last week’s volatility shook up the absolute and relative analysis scores and placements of many sectors and factors. As shown in the first graphic, courtesy of SimpleVisor, Industrials and Materials, which were extremely overbought, have underperformed and are now trading closer toward fair value. Within the top graph, on the right side, you can see how both sectors have rotated from the top right corner, signifying overbought on relative and absolute scores. At the same time, the Staples sector continues to climb the charts. Note that the Utility sector is finally moving higher across both scores. Might it be following Staples?
The second graphic shows how the volatility of the last week has shaken up the Technology sector. The three largest stocks by market cap in the S&P 500 and the Technology sector ETF (XLK) span the overbought-oversold range. NVDA has risen nicely to overbought, while Apple has improved to fair value, and Microsoft, with its poor price performance due to earnings, is now very oversold. It’s also worth noting that the Gold Miner factor, which was extremely overbought, fell to fair value in less than a week. That is a sharp move for this analysis, but consider its price fell by 15% late last week.
(Click on image to enlarge)

(Click on image to enlarge)

The Market Cycles Potentially Driving 2026 Returns
Market cycles are once again at the center of the investment narrative as we head into 2026. The optimism is familiar as earnings held up in 2025, the economy avoided recession, and big tech lifted the indexes. However, those victories are already reflected in the price. As we head into 2026, with valuations extended, the margin for error has narrowed. However, while analysts are very optimistic for this year, the case for another strong year leans heavily on historical patterns.
Let’s start with the Presidential Cycle. Market cycles tied to the presidential calendar suggest the second year of a new administration is often slower. Since 1948, years three and four of a presidential term have yielded the most substantial returns, while year two, or the post-election year, has shown weaker performance, with modest gains and lower win rates. The data is shown below, and while 2025 traded above historical norms, 2026 may not be as fortunate.
(Click on image to enlarge)
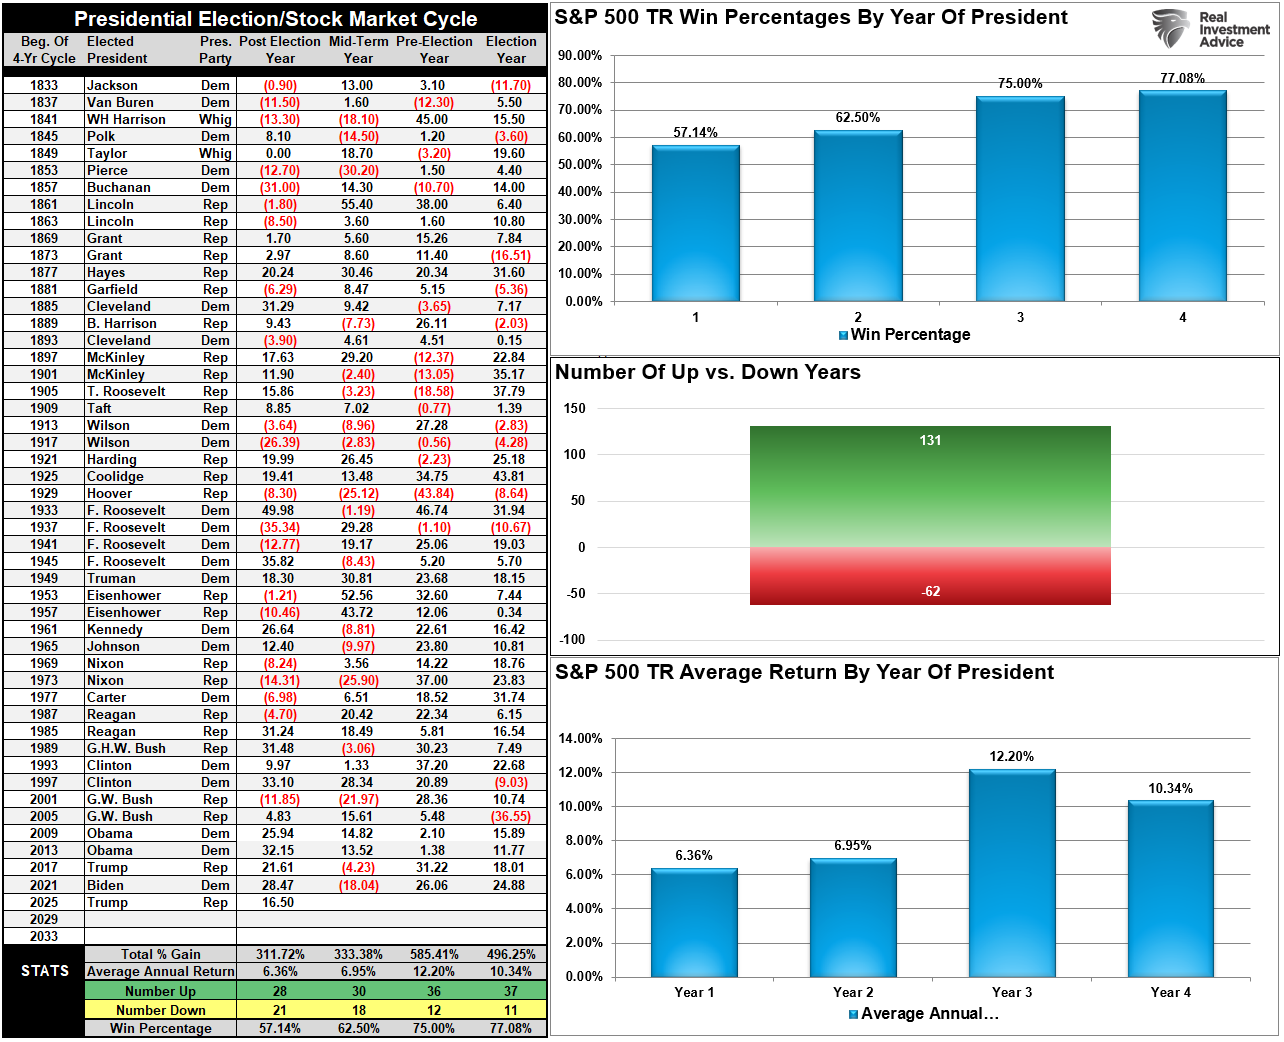
Since 1871, markets have gained in 30 of those years, with losses in only 18, resulting in a win rate of approximately 62%. While better than a “coin toss,” it falls well short of the win rate in years three and four. Another potential headwind for markets in 2026 is the midterm elections, which could potentially result in a change of control in the House or Senate, leading to increased gridlock in Washington.
Tweet of the Day

More By This Author:
The Market Cycles Potentially Driving 2026 ReturnsWarsh To Head The Fed
Meta And Microsoft: Great Earnings But Different Results
Disclaimer: Click here to read the full disclaimer.


