
With over 75% support, Tesla shareholders approved Elon Musk’s record-breaking, one trillion dollar executive compensation package. The deal is contingent on Musk delivering significant value to shareholders. The package is an all-stock plan structured into 12 tranches. If he meets all the milestones, Musk could receive as many as 423.7 million additional shares, equating to 12% of the company. The one trillion-dollar payout is massive, but consider what Musk must do over the next ten years to receive the full payout.
- Boost Tesla’s market cap to $8.5 trillion. $8.5 trillion is almost twice Nvidia’s market cap and a 6x increase from its current level.
- Deliver 20 million Tesla vehicles cumulatively over the ten years. Its 2025 sales are projected to be 1.6 million.
- Sell or deploy 1 million Optimus robots.
- Operate 1 million robotaxis without safety drivers.
- Secure 10 million active full self-driving subscriptions (FSD). This entails selling its FSD software to other automakers.
- Earn $400 billion in adjusted annual EBITDA over multiple periods. Year to date, Tesla’s EBITDA was just under $13 billion.
While the one-trillion-dollar payout is astonishing, the milestones he must meet to get paid are daunting. Proponents of the deal believe that if Musk delivers on the goals, the rewards for shareholders will be well worth the award. Critics say it is excessive and exacerbates wealth inequality. Others are concerned that the deal grants Musk unchecked power without enough oversight.
What To Watch Today
Earnings
(Click on image to enlarge)

Economy
- No notable releases today
Market Trading Update
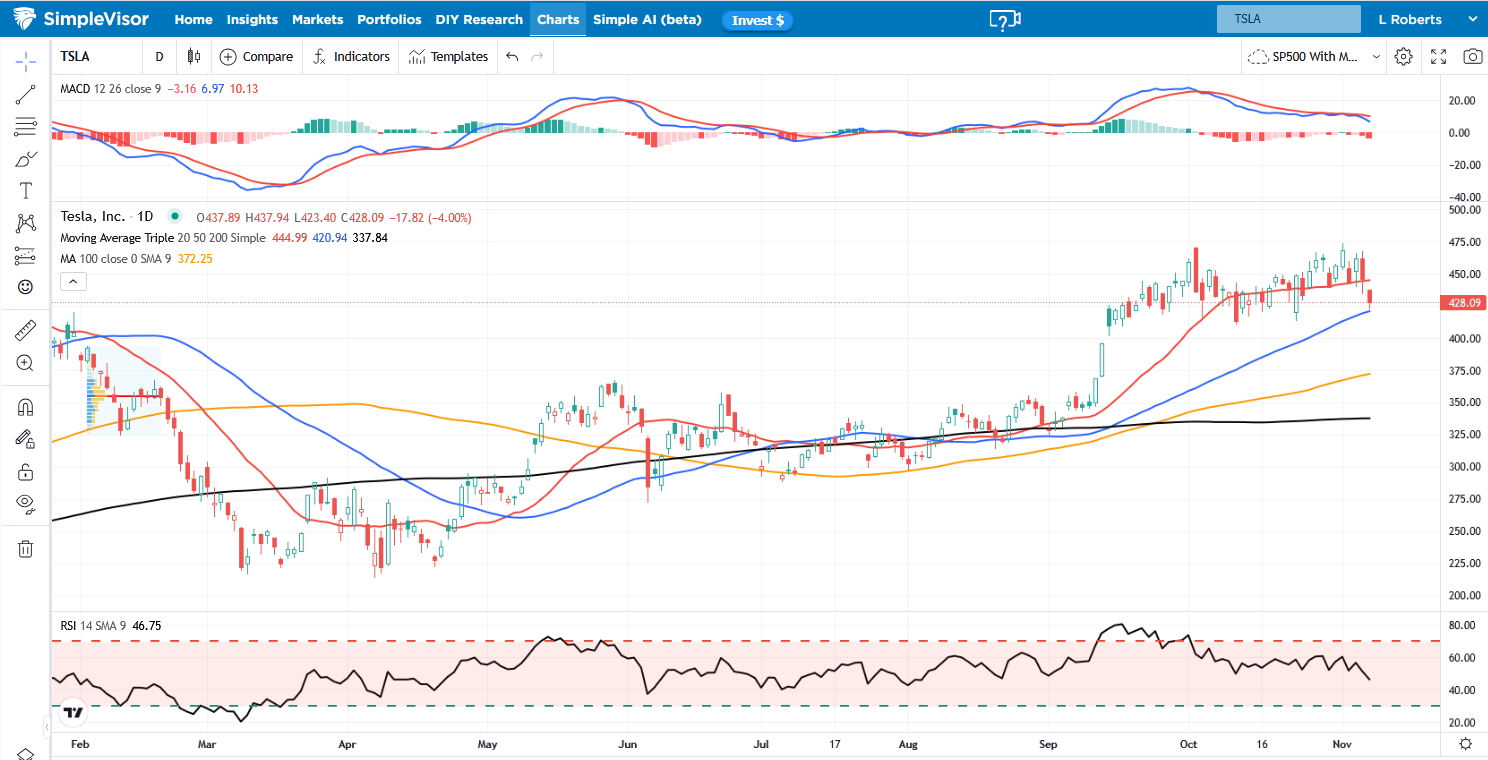
As noted on Friday, several indicators warrant caution about the current market. While the index remains in a defined uptrend and continues to trade above its 50-day and 200-day moving averages—both of which are still rising—the strength of the move is increasingly in question. Momentum remains constructive, with the MACD in a buy signal posture, and the 20-day moving average held as support. But the underlying structure of the market is weakening.
Breadth has notably deteriorated, with the number of stocks outperforming the benchmark index at levels typically associated with larger market corrective processes. Fewer stocks are participating in the upside, and internal momentum is fading. As of Friday, only 55.4% of S&P 500 components remained above their 200-day moving average, a meaningful decline from earlier levels this year. The number of stocks above their 50-day moving average has dropped even more sharply, down to just 40%, with participation narrowing in key sectors.

The market corrected about 3.5% from its all-time highs and remains above the 50-day moving average for now, keeping the bullish trend intact. However, money flow has deteriorated sharply, although we are seeing some buyers entering the market at the 50-day moving average on Friday, confirming support at that level. Relative strength has essentially reversed most of its previous overbought condition. Still, it remains in negative divergence overall, while momentum has triggered a short-term sell signal, which will keep a lid on advances for now.
(Click on image to enlarge)

Technically, the setup remains bullish based on price action alone, but structurally, it is not robust. Breadth weakness, momentum divergence, and declining volume on rallies are red flags. The rally is vulnerable to sharp reversals if broader participation does not materialize soon. A strong trend built on a narrowing foundation is inherently unstable.
Support and Resistance Levels
- Primary Resistance: ~6,850–6,900 (top of the rising trend channel and previous highs)
- Initial Resistance: ~6,767 (approximate 20‑day moving average)
- Initial Support: ~6,674 (approximate 50‑day moving average)
- Primary Support: ~6,497 (100-day moving average)
- Critical Support: ~6,134 (200-day moving average)
In this environment, investors should remain disciplined. The trend is intact, but fragility is growing. Participation in the rally is permissible, but positions should be hedged or trimmed where appropriate. Stops should be tightened on extended names. Without confirmation from broader market internals or macro data, the path forward could become more volatile.
The Week Ahead
This week looks to be a quiet one, with little economic data in large part due to the government shutdown and few earnings. That said, a resolution to the shutdown, which is looking more likely, should set a timeline for the release of critical employment and inflation data.
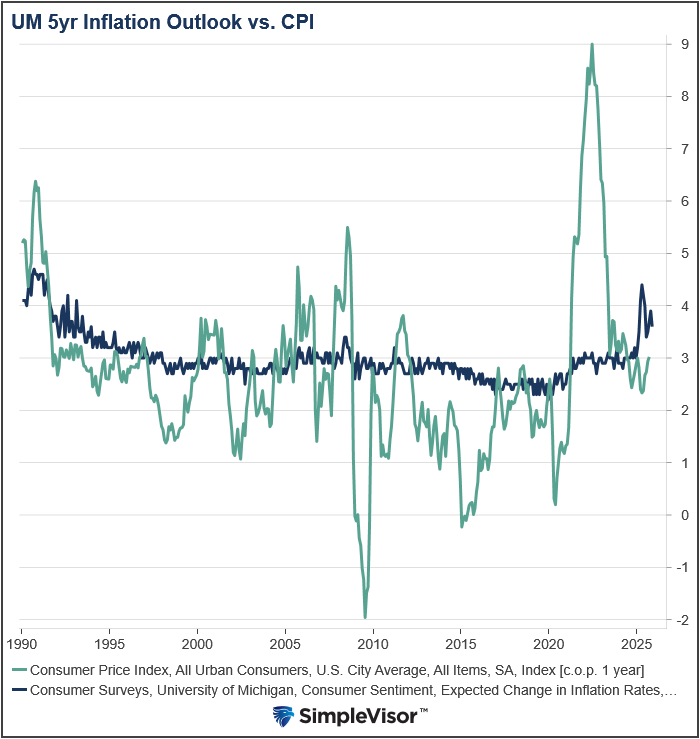
On Friday, the University of Michigan’s five-year consumer inflation outlook fell from 3.9% to 3.6%. The gauge peaked at 4.4% in April. Some in the media tout the recent decline as good news. We argue, based on the graph below, that it’s meaningless. As shown, the University of Michigan survey anticipated only a minor uptick in inflation in 2020-22, despite a tripling of the CPI. However, it did expect a 1.5% increase due to tariffs. When graphed against CPI, you can see that the Michigan survey number has no predictive value. Thus, while it may be good from an economic perspective that consumers are less worried about inflation, it is not a reliable indicator of future inflation.
“Money Printing” By The Fed: Fact Or Fiction?
I recently penned an article on “Money Supply Growth,” which elicited a very thoughtful response from Garrett Baldwin via Substack. He argued that labeling Federal Reserve operations as “money printing” is not rhetoric, but rather a reality. He points to Ben Bernanke’s 2010 interview, where Bernanke described how the Fed marks up digital accounts.
But Garrett’s view, while valid in parts, overlooks how the system functions. To understand money supply growth, it is essential to distinguish between reserve creation and deposit creation.
Garrett argues that referring to the Federal Reserve’s operations as “money printing” is not merely rhetorical but structurally accurate. He states:
“When I refer to ‘money printing,’ I’m describing the Fed’s ability to create unlimited digital reserves to purchase government debt … and how Treasury operations affect leverage in the financial system.”
Garrett believes this process functions equivalently to printing money and should be treated as such. While this perspective highlights the scale and potential consequences of monetary interventions, it risks misrepresenting the process by which money is created in a modern banking system. To unpack this, it’s critical to distinguish between reserve creation by the Federal Reserve and the creation of broad money (such as deposits) by commercial banks.
Let’s start with how the Fed creates “reserves.”

More By This Author:
Repo Market: Critical Warning Or Bullish SignalOpenAI Seeks Government Support
“Money Printing” By The Fed: Fact Or Fiction?


Comments
Log in or sign up to join the conversation.