

Image Source: Pixabay
Watch the video extracted from the WLGC session on 3 Oct 2023 below to find out the following:
- How to use the up wave and down wave to judge the trend of the S&P 500
- How to form a directional bias with price action in conjunction with October's seasonality?
- How to interpret the downward momentum with the price action?
- What key level should investors pay attention to in order to gauge the S&P 500 direction?
- And a lot more
Video Length: 00:05:24
The bullish vs. bearish setup is 77 to 494 from the screenshot of my stock screener below pointing to a very negative market environment.
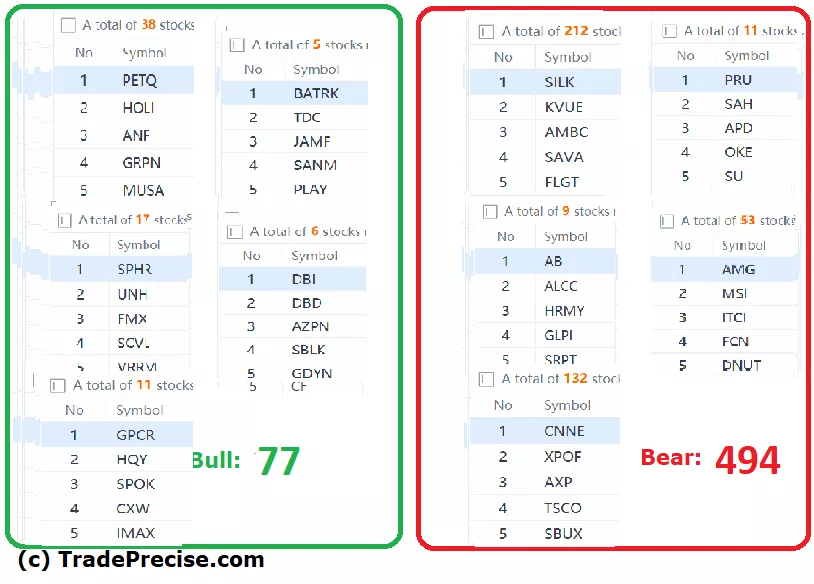
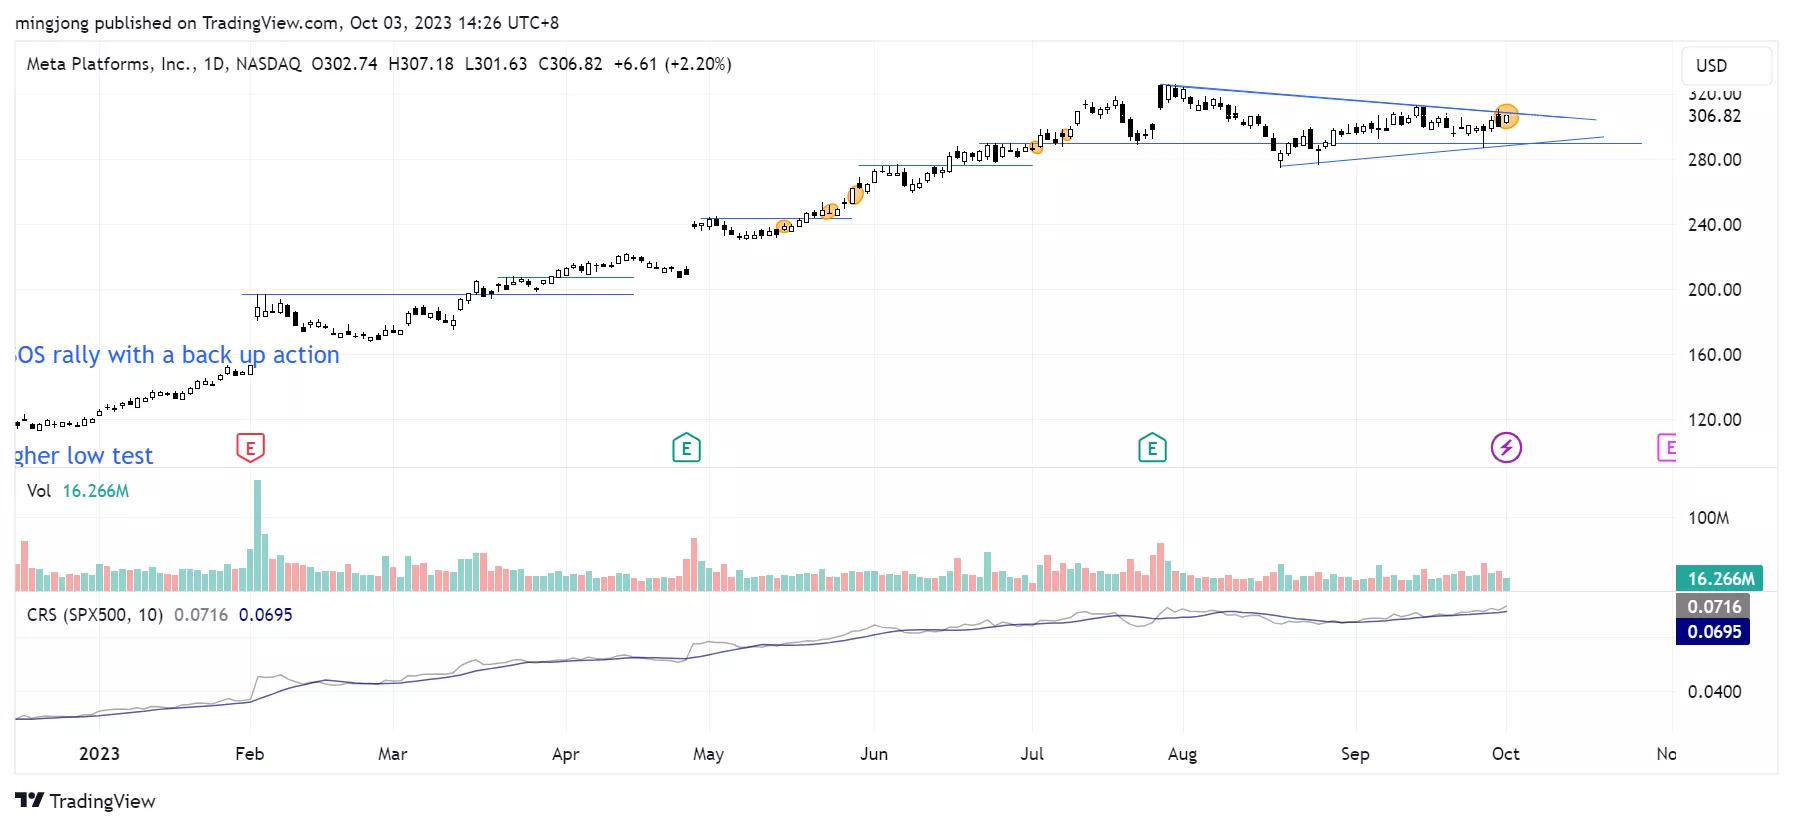
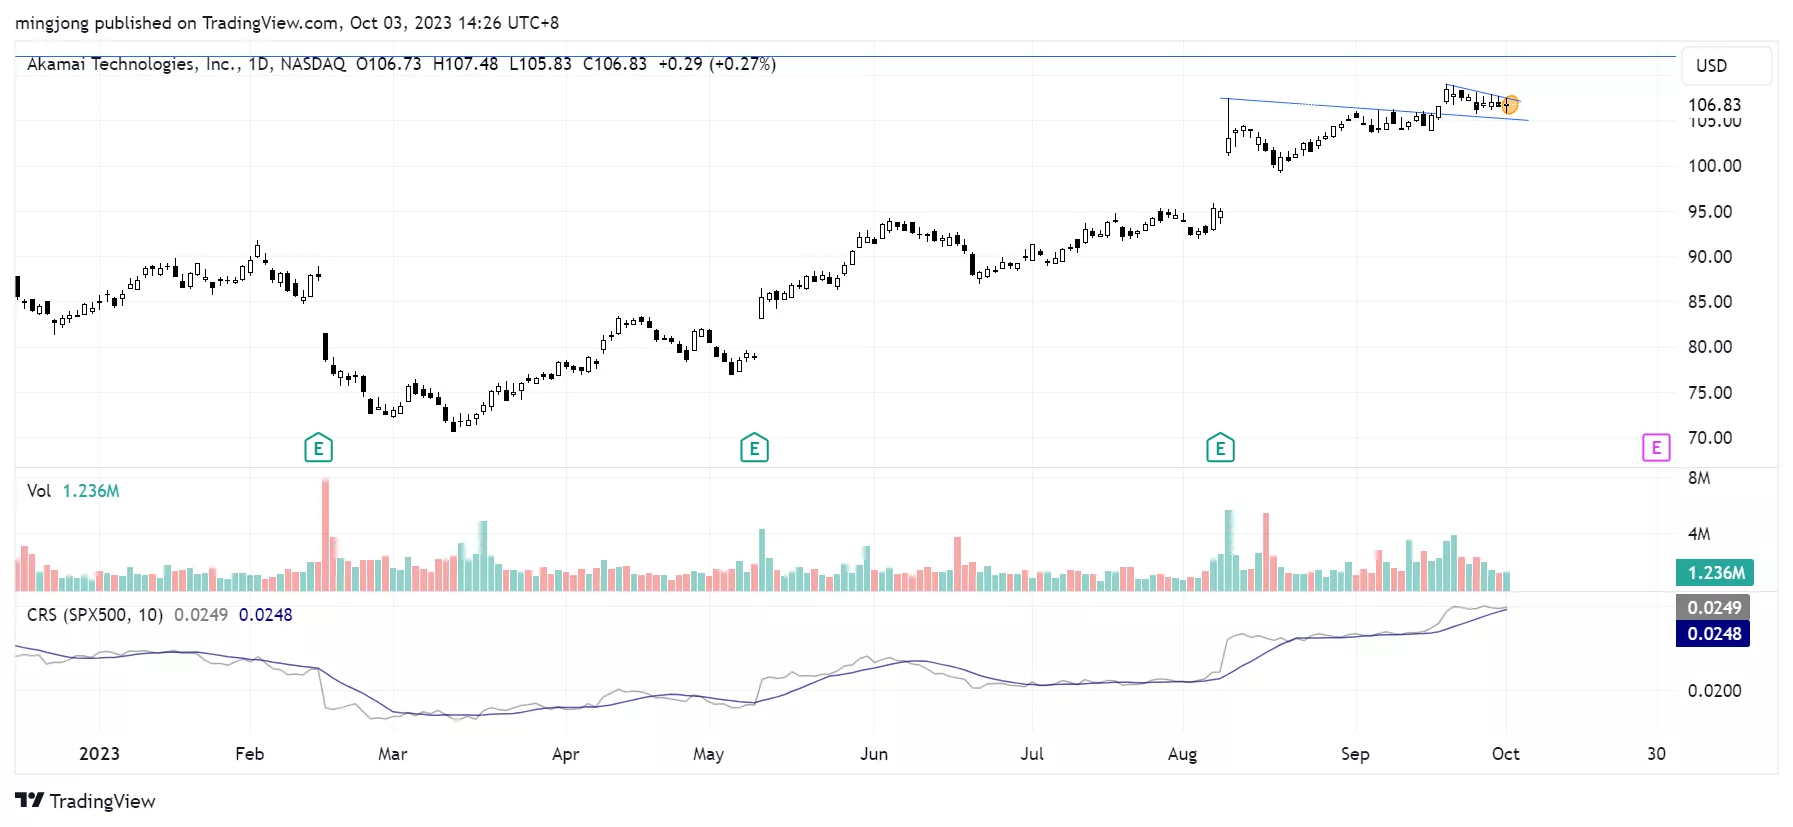
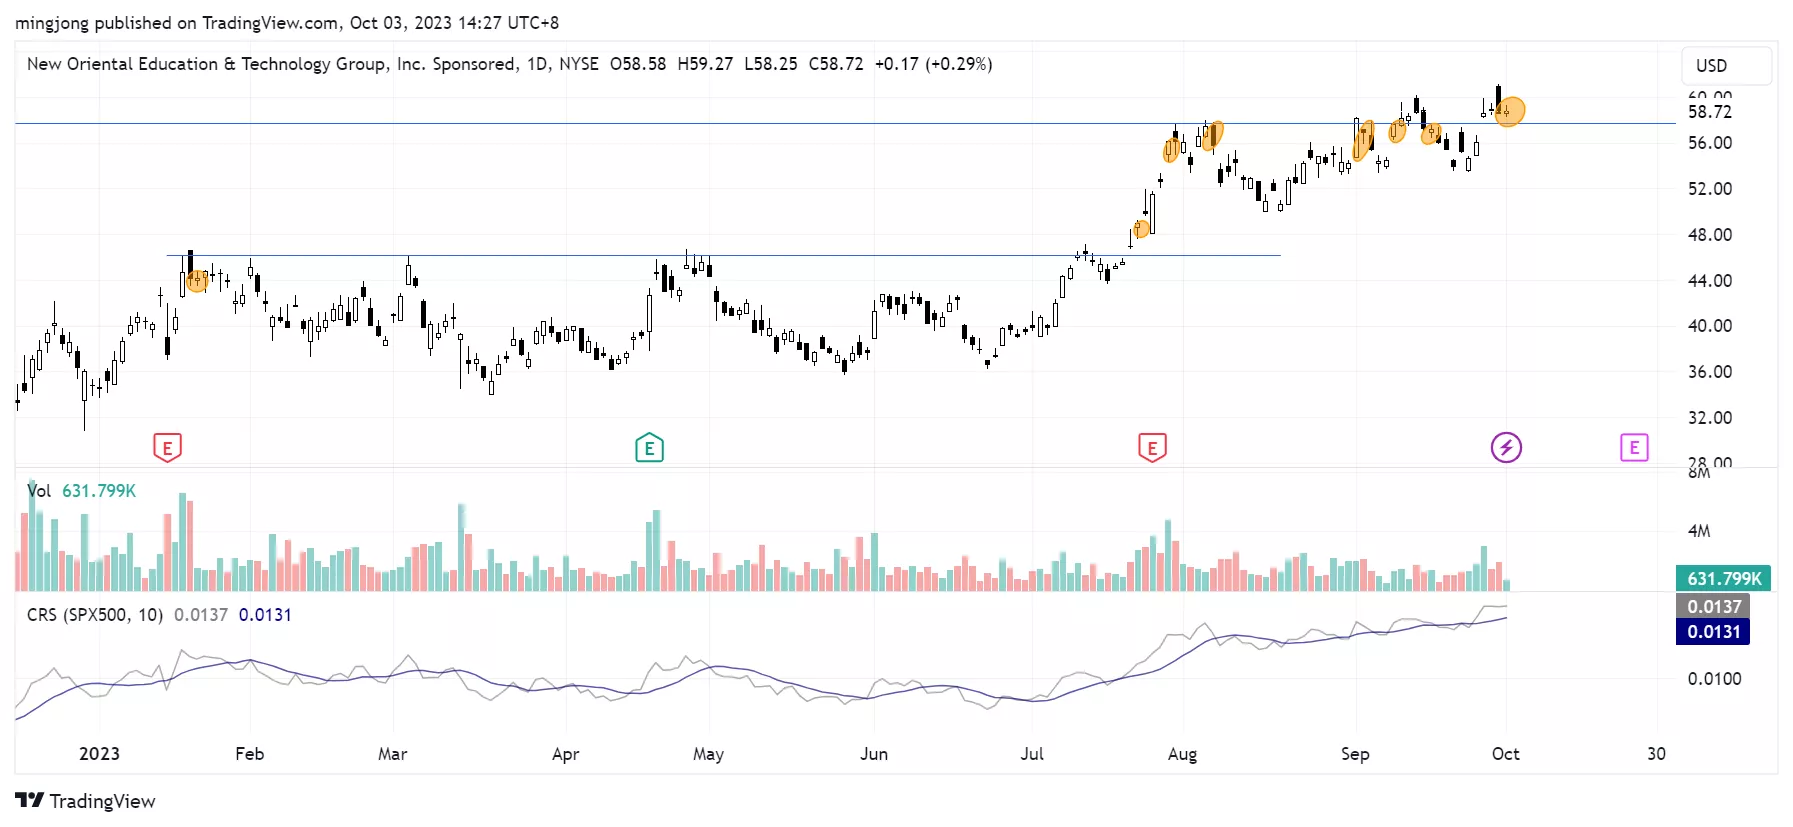
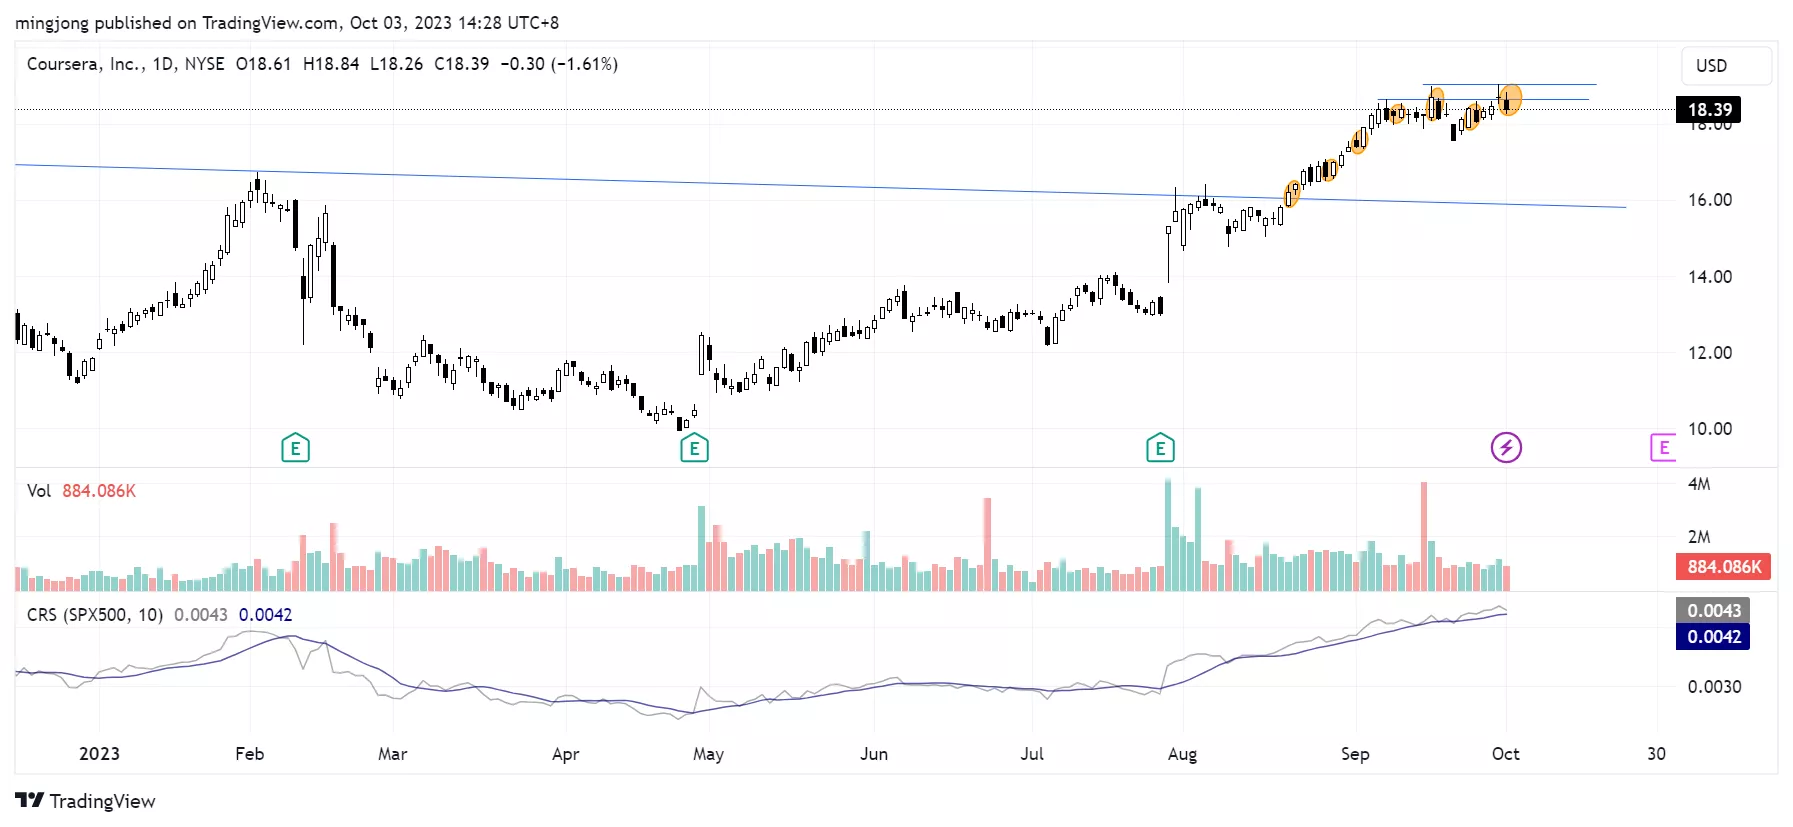
5 “low hanging fruits” (META, AKAM, etc…) trade entries setup + 18 others (EDU, COUR, etc…) plus 25 “wait and hold” candidates are discussed in the video (31:37) accessed by subscribing members below.
(Click on image to enlarge)
(Click on image to enlarge)
(Click on image to enlarge)
(Click on image to enlarge)
More By This Author:
Is The Stock Market On The Brink Of A Meltdown? Here's What You Need To Know
Is The FOMC About To Rock The Market Boat Again? Brace For A Potential Selloff!
S&P 500 Pullback Update: Are We Nearing The Light At The End Of The Tunnel?


Comments
Log in or sign up to join the conversation.