Is The Stock Market On The Brink Of A Meltdown? Here's What You Need To Know
Image Source: Unsplash
The following video is extracted from the live session on 27 Sep 2023. In this video, you will find out the following:
-
The deeply oversold level S&P 500 could hit before a technical rally
-
How to spot outperforming stocks during the correction
-
How a shakeout or capitulation scenario could occur
-
The key level for a trend reversal
-
And a lot more
Video Length: 00:06:10
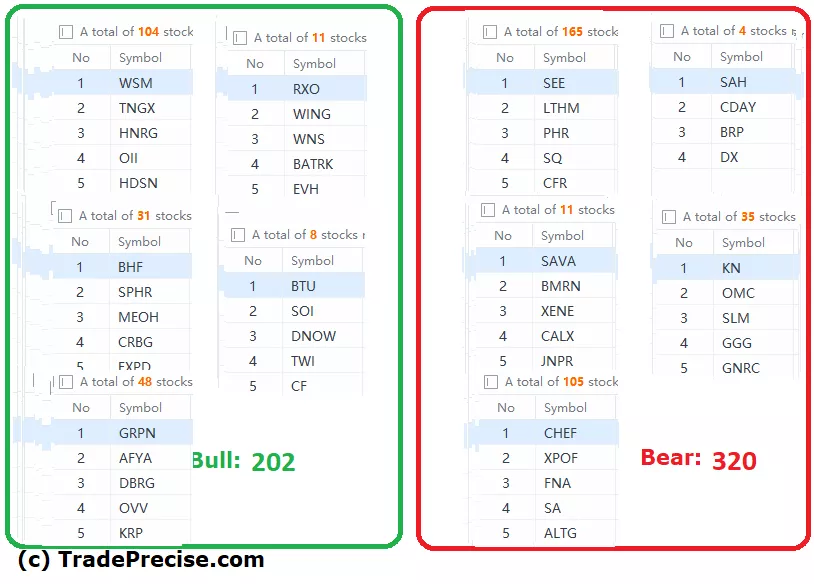
The bullish vs. bearish setup is 202 to 320 from the screenshot of my stock screener below pointing to a negative market environment.
The long-term market breadth also points to a negative environment while the short-term market breadth approaches a deeply oversold level, which could be a meaningful condition for a technical rally.
7 “low hanging fruits” (DELL, ET, etc…) trade entries setup + 13 others (TDW, FTI, etc…) plus 23 “wait and hold” candidates have been discussed during the live session.
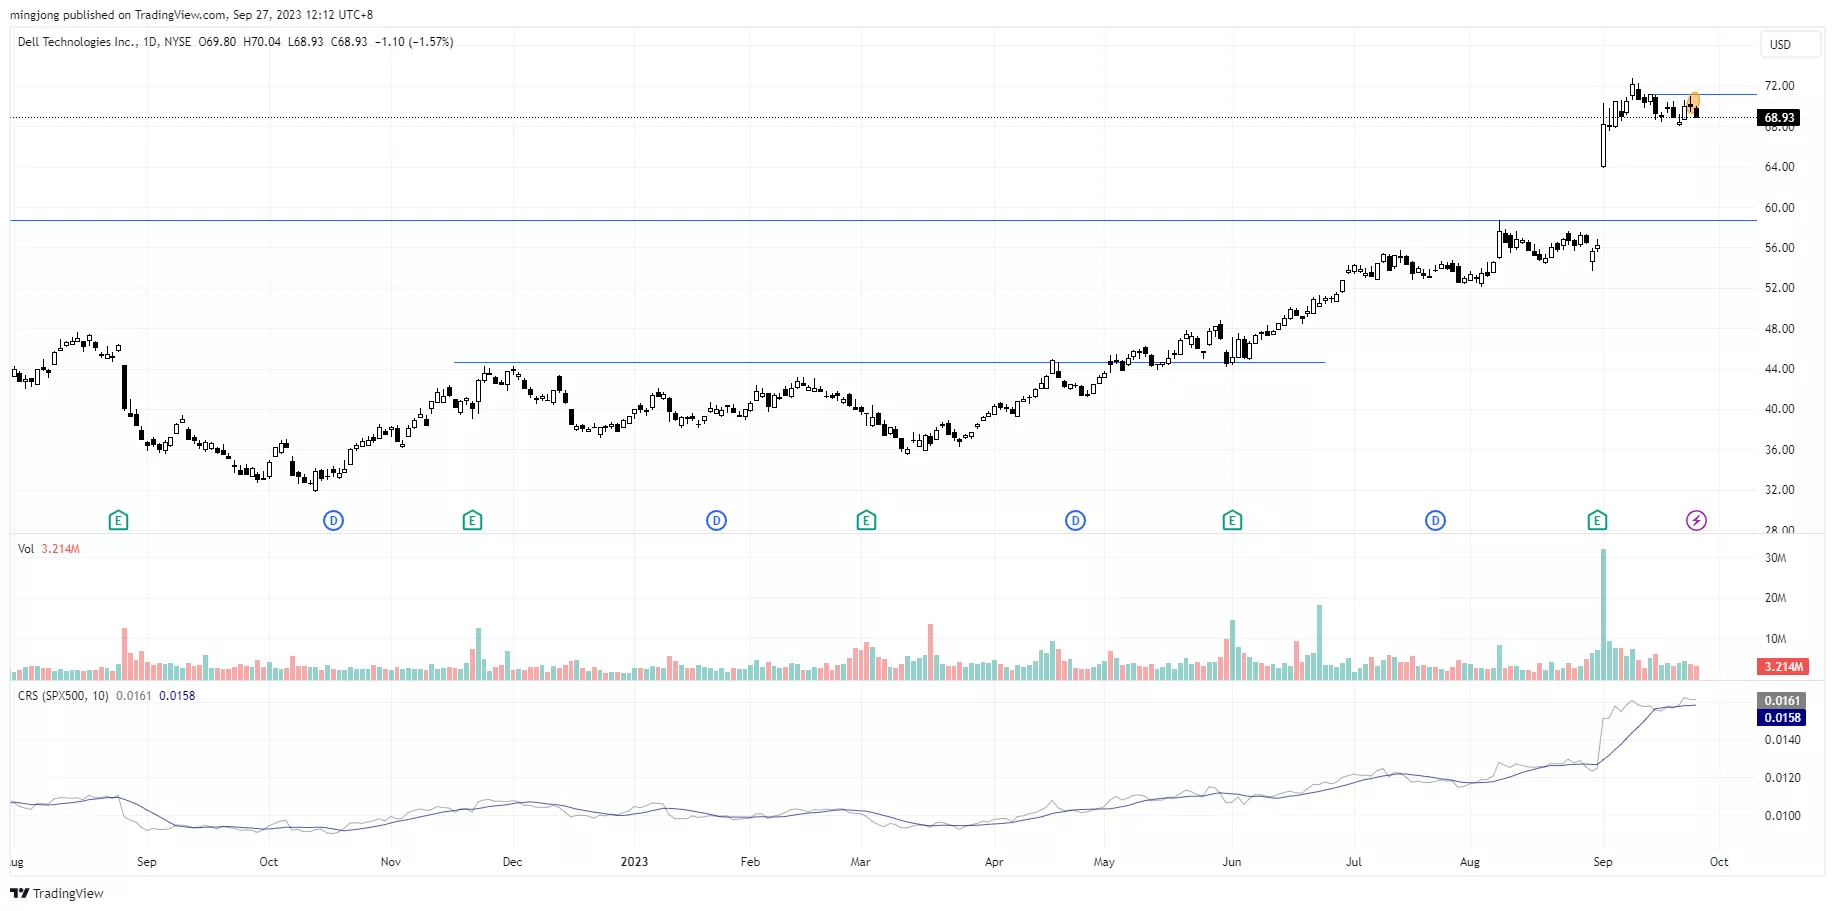
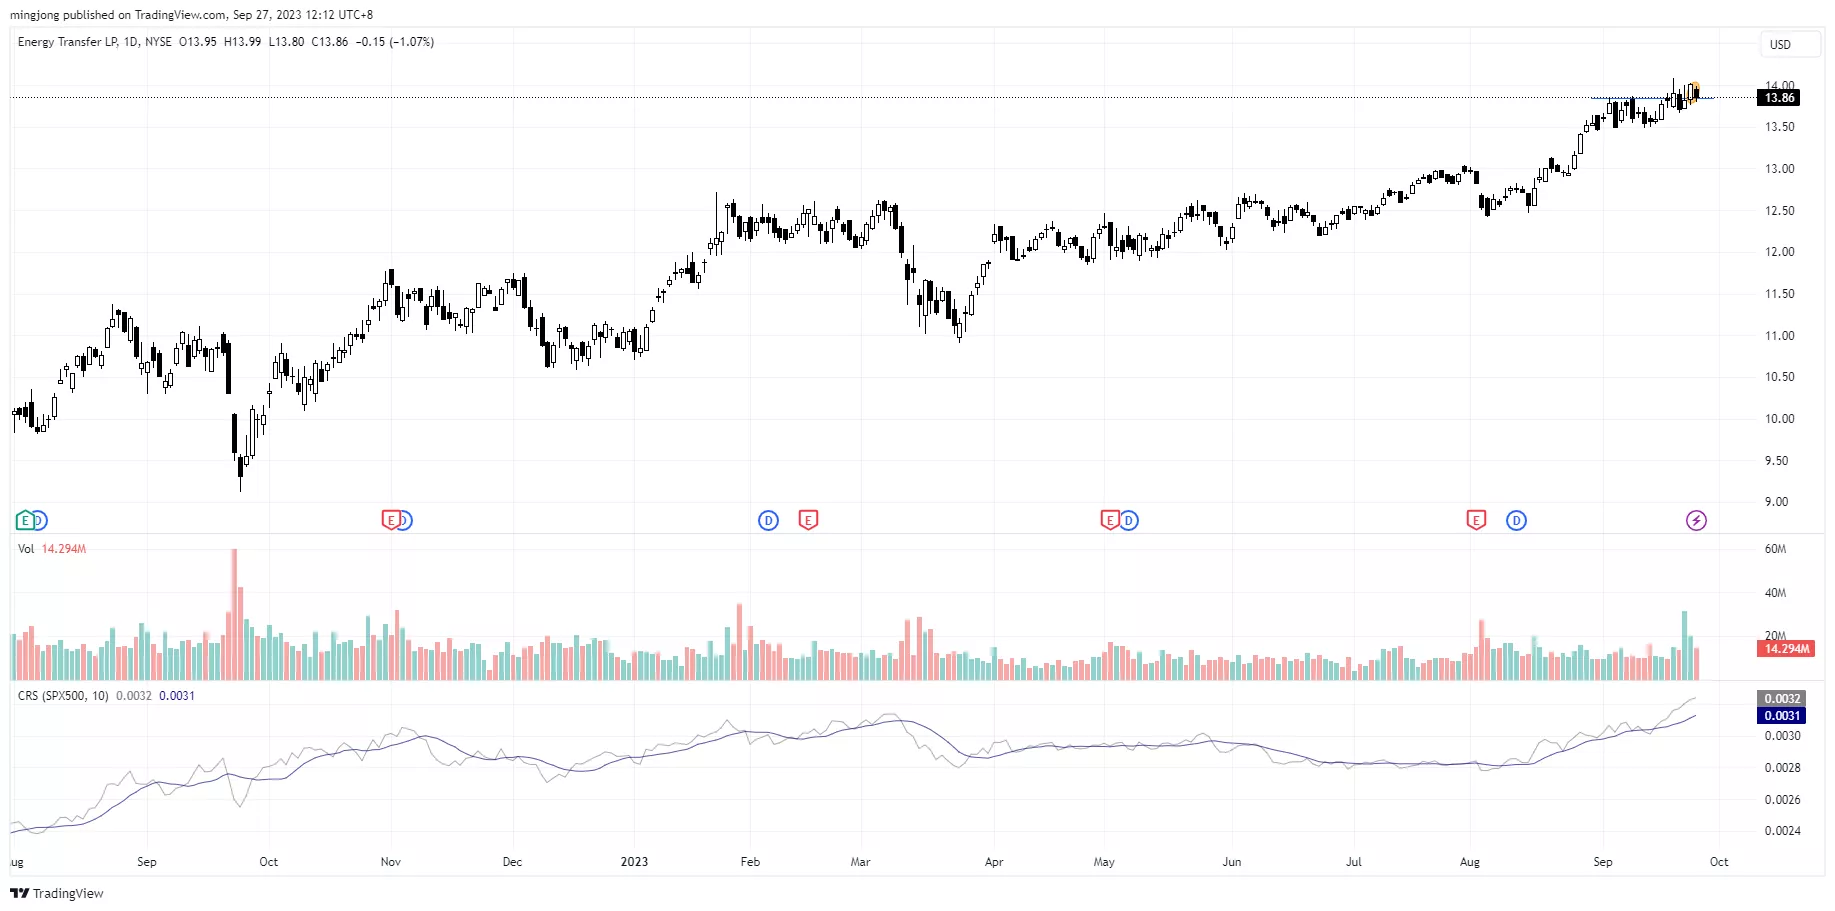
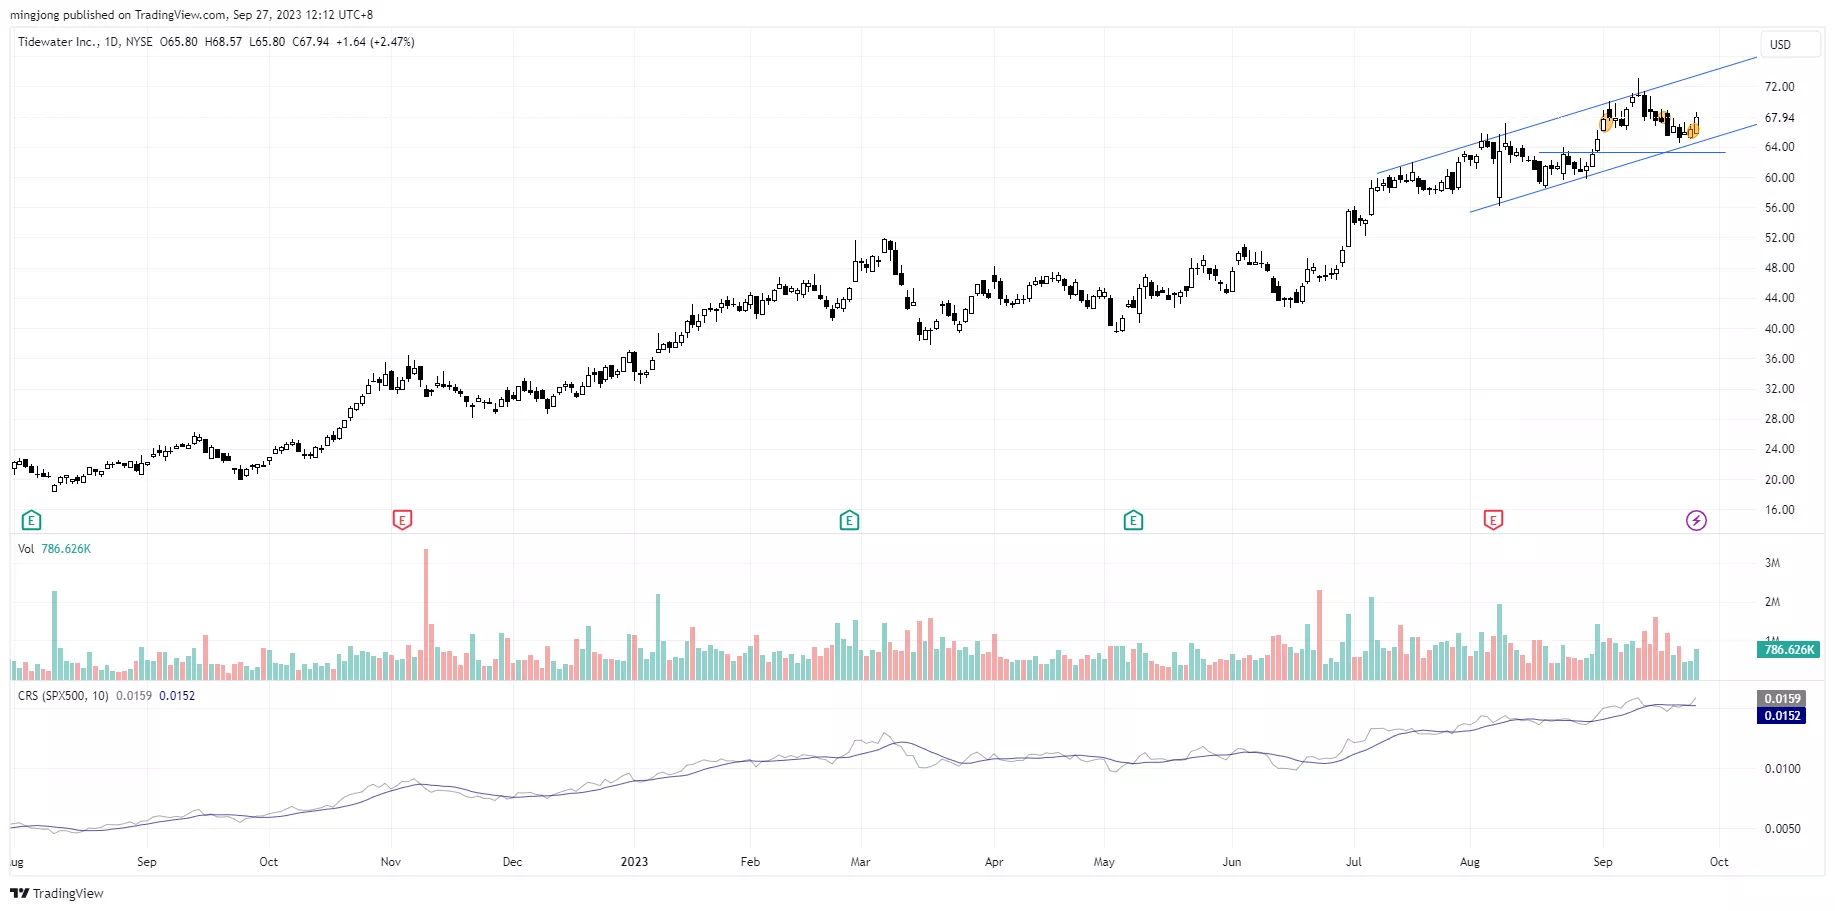
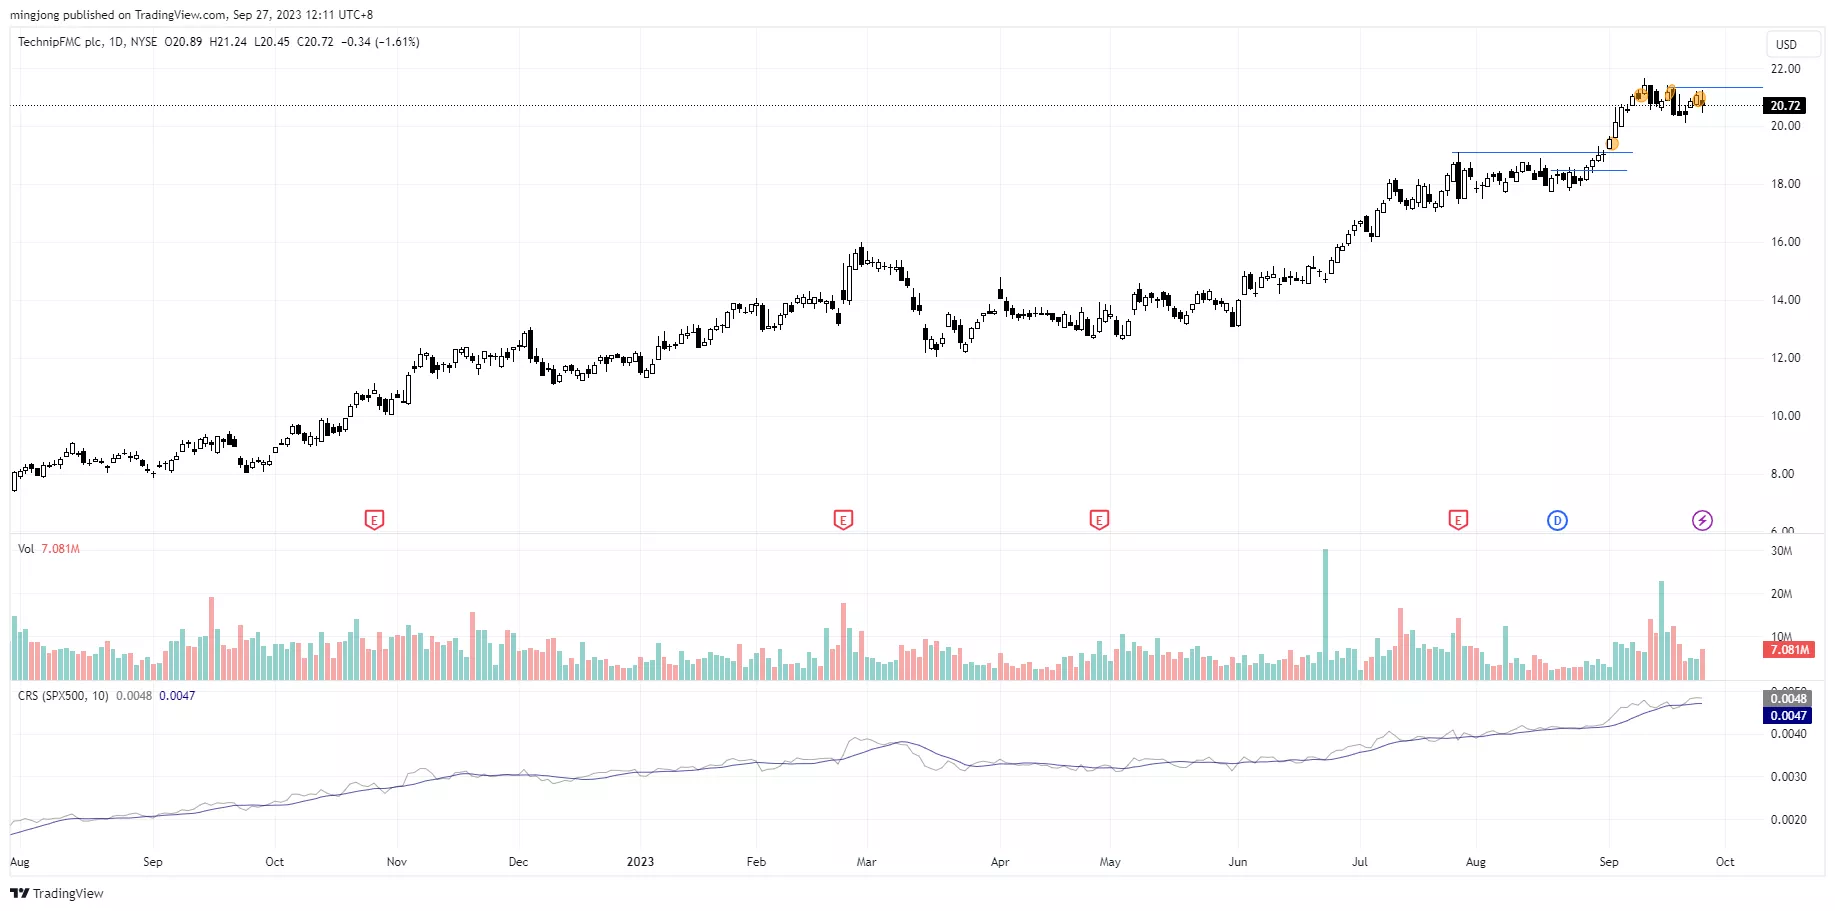
If there are stocks bucking the trend (or even consolidating) while the index is going down, they show a lot of relative strength. Those are the stocks that will outperform when the index undergoes a relief rally rebound.
Let me know what you think.
More By This Author:
Is The FOMC About To Rock The Market Boat Again? Brace For A Potential Selloff!
S&P 500 Pullback Update: Are We Nearing The Light At The End Of The Tunnel?
Spot The Hidden Supply And Derive The Strength Of The Market Structure
Disclaimer: The information in this presentation is solely for educational purpose and should not be taken as investment advice.


