
Newmont Corporation - NEM Stock Analysis And Elliott Wave Technical Forecast

Image Source: Unsplash
ASX: NEWMONT CORPORATION - NEM Elliott Wave Technical Analysis
TradingLounge
Greetings, traders!
Today's Elliott Wave update on the Australian Stock Exchange (ASX) focuses on Newmont Corporation - NEM.
We observe ASX: NEM advancing within a strong wave three, and this analysis offers detailed target points and invalidation levels, helping traders understand when the current bullish trend might conclude or continue.
ASX: NEWMONT CORPORATION - NEM Elliott Wave Technical Analysis
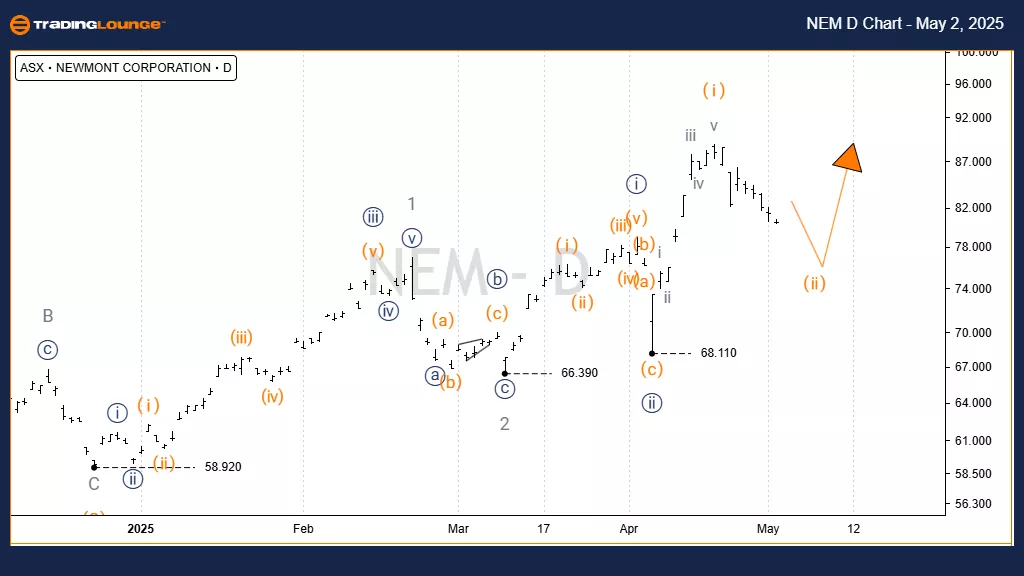
1D Chart (Semilog Scale) Analysis
Function: Major trend (Intermediate degree, orange)
Mode: Motive
Structure: Impulse
Position: Wave 3 - grey of Wave (3) - orange
Details:
Wave 2 - orange completed around $58.92.
Wave 3 - orange has begun moving higher, subdividing into wave 1 - grey, wave 2 - grey, and now wave 3 - grey continues rising.
The current target for wave 3 - grey is the $100.00 to $102.37 area.
Invalidation Point: $68.11
(Click on image to enlarge)
ASX: NEWMONT CORPORATION - NEM Elliott Wave Technical Analysis
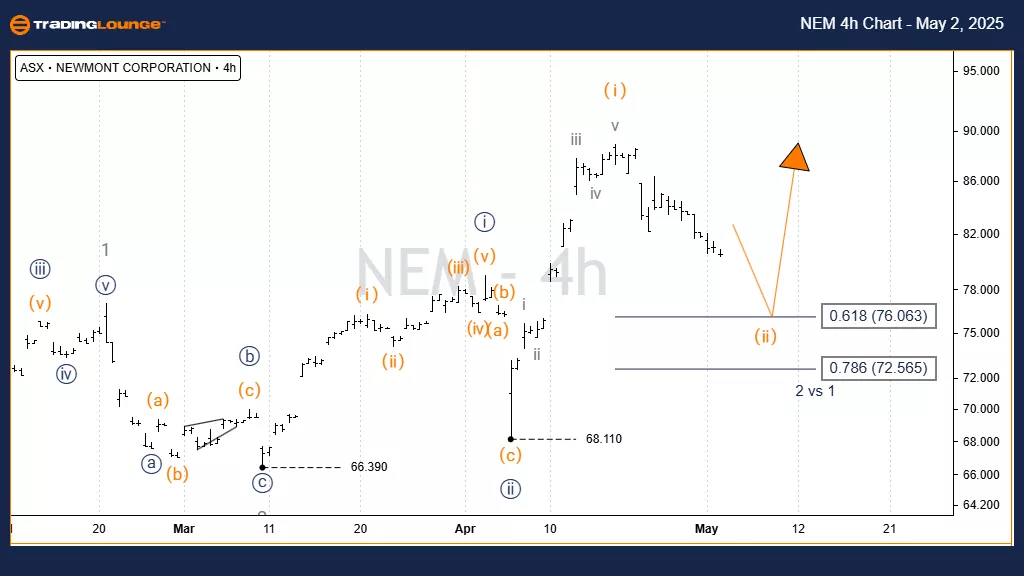
4-Hour Chart Analysis
Function: Major trend (Minor degree, grey)
Mode: Motive
Structure: Impulse
Position: Wave ((iii)) - navy of Wave 3 - grey
Details:
Since the $58.92 low, wave 3 - orange has been unfolding upward.
The current movement is identified as wave iii)) - navy, progressing toward the $102.37 target.
The price must remain above $68.11 to maintain this bullish scenario.
The $79.00 level is critical: if price action overlaps it, wave counts would require adjustment.
Specifically, wave i) - orange must not be overlapped by wave iv))) - navy to maintain the impulsive structure.
Invalidation Points: $68.11 and $79.00
(Click on image to enlarge)
Conclusion
Our technical analysis, contextual trend forecast, and short-term outlook for ASX: Newmont Corporation - NEM aim to deliver actionable insights.
We offer clearly defined validation and invalidation price points to improve trading confidence.
By integrating technical precision and objective analysis, we help traders navigate current market trends professionally and effectively.
Technical Analyst: Hua (Shane) Cuong, CEWA-M (Master’s Designation)
Source: Visit TradingLounge.com and learn from experts.
More By This Author:
Energy Select Sector ETF XLE - Elliott Wave Technical Analysis
Trading Strategies For S&P 500, Nasdaq 100, DAX 40, FTSE 100 & ASX 200
Qualcomm Inc. - Elliott Wave Technical Analysis
At TradingLounge™, we provide actionable Elliott Wave analysis across over 200 markets. Access live chat rooms, advanced AI & algorithmic charting tools, and curated trade ...
more

