Median CPI May Be A Window On Fed’s Inflation Caution
Last week, the Federal Reserve disappointed markets once again with its refusal to acknowledge the market’s belief in the end of the inflation threat. The opening statement for December’s decision on monetary policy delivered the familiar refrain: “The Committee anticipates that ongoing increases in the target range will be appropriate in order to attain a stance of monetary policy that is sufficiently restrictive to return inflation to 2 percent over time.” During the press conference, Chair Powell further emphasized that the Fed has yet to see substantial evidence that inflation will continue to come down in a sustained way. So while the Fed is slowing the pace of rate hikes, the Fed will continue hiking past the market’s peak rate expectations. Powell even rebuffed once again the notion that the Fed will cut rates next year. So if inflation has peaked, why is the Fed so “stubborn”? The dynamics in median CPI may be a window on the Fed’s inflation caution.
Every month, financial markets receive a bevy of inflation reports. The Federal Reserve watches all of them as is clear from the various research papers and metrics the various Federal Reserve banks produce. The Federal Reserve Bank of Cleveland produces a monthly report on the median CPI and the 16 percent trimmed-mean CPI. Per the definition provided with the report:
“Median CPI is the one-month inflation rate of the component whose expenditure weight is in the 50th percentile of price changes. 16 percent trimmed-mean CPI is a weighted average of one-month inflation rates of components whose expenditure weights fall below the 92nd percentile and above the 8th percentile of price changes.”
Why use the median CPI and the 16% trimmed-mean CPI? The Cleveland Fed explains: “By omitting outliers (small and large price changes) and focusing on the interior of the distribution of price changes, the median CPI and the 16 percent trimmed-mean CPI can provide a better signal of the underlying inflation trend than either the all-items CPI or the CPI excluding food and energy (also known as core CPI).”
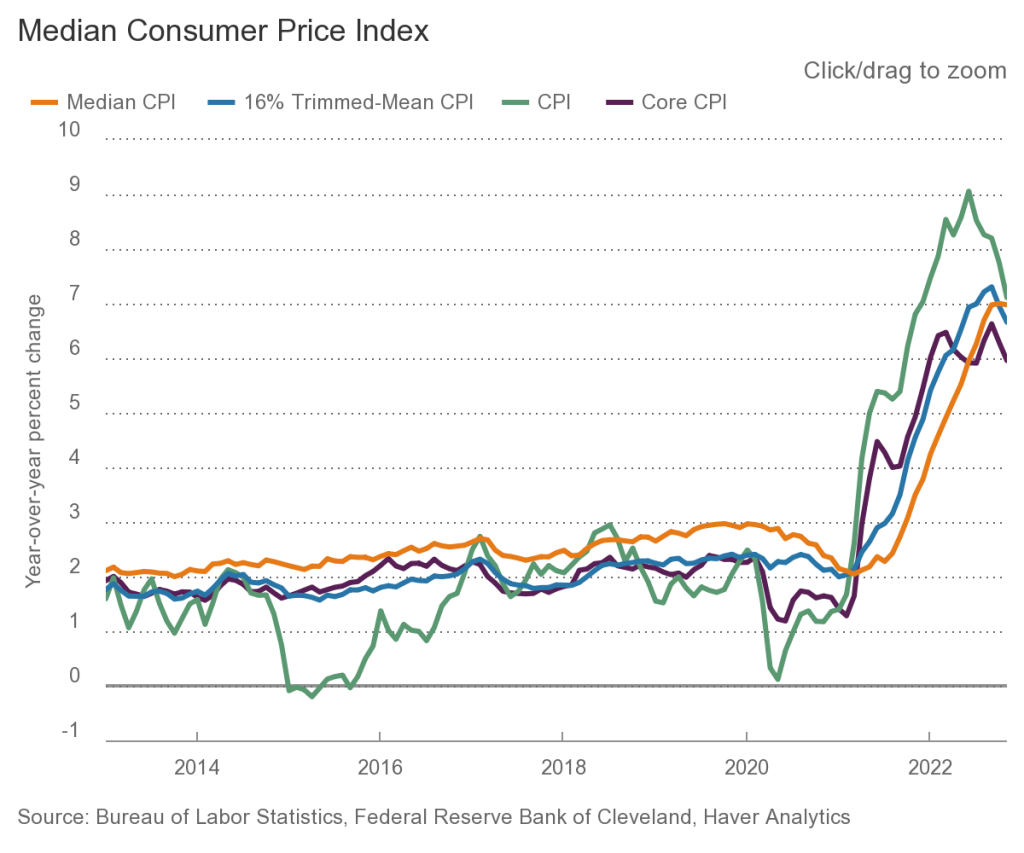
This effective smoothing of the inflation dynamics produces a lag in the peak for inflation and shows almost no indication that inflation is ready to come down in the sustained fashion the Fed wants to see. In the chart below, the yellow line is the median CPI, and the greyish blue line is the 16% trimmed-mean CPI. For November, the order from top to bottom is the (headline) CPI, median CPI, 16% trimmed-mean CPI, and the core CPI.
(Click on image to enlarge)
The trend is NOT yet down. If these were stock charts, I would even argue an uptrend remains in place.
The 16% trimmed-mean CPI looks like it has likely peaked, but the topping pattern lacks the double-topping that makes the peak in core CPI look so convincing. The median CPI is the worst news for those who think the inflation threat is already over: this measure is just now plateauing after streaking straight upward since late last year. Sure, there are all sorts of forward-looking measures that the Fed sees as confirming a peak in inflation, but there is little saying the inflationary pressures are going to come down sufficiently and conclusively. The Fed’s risk management framework thus mandates that the Fed proceed with caution. The magnitude of decline that mollifies the Fed remains anyone’s guess. Meanwhile, interest rates are still fighting the Fed and likely more focused on the prospects for a 2023 recession.
(Click on image to enlarge)
The iShares 20+ Year Treasury Bond ETF (TLT) is hovering at levels last seen three months ago. TLT looks like it bottomed out in October/November. Source: TradingView.com
Be careful out there!
Full disclosure: no related positions
More By This Author:
The Fed Plants A Flag On Peak Inflation And An Economic Soft Landing
Stock Market Loves Powell Moving From “Keep At It” To “Stay The Course” On Fighting Inflation
The Swiss National Bank Knows More About Inflation Than You Do


