
Market Outlook For 2026

Image Source: Pixabay
Market Brief – Strong Year-End Returns Lead to Bullish Market Outlooks
Let’s start this week by wishing you a blessed, happy, and prosperous New Year. We are looking forward to spending another year working together to build better portfolio outcomes. With that said, let’s dig into what happened in 2025.
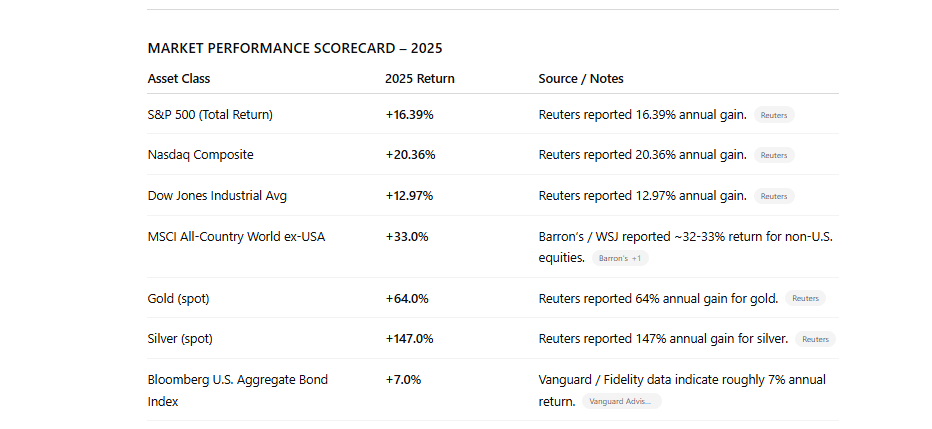
Markets ended 2025 on a firm footing despite volatility across asset classes and sectors. The S&P 500 finished the year up 16.4%, marking its third consecutive annual gain. The Nasdaq led major indexes with a 20.4% increase, reflecting investor demand for growth stocks and renewed enthusiasm for AI-related sectors. The Dow Jones Industrial Average gained nearly 13%, lagging the broader market but still posting a solid return driven by financials and industrials.
Much of the strength in equities was generated following the “Liberation Day” market decline in April. Investors were eager to price in a Federal Reserve pivot as inflation trends softened. Speaking of, headline CPI slowed materially in the second half of 2025, while core inflation began to show signs of easing. Treasury yields fell sharply between October and December, reversing much of the year’s earlier rise. For now, expectations for rate cuts in 2026 remain high, which is supporting the increase in both equity multiples and bond prices.
Outside of U.S. stocks, global equity markets posted some of their strongest performance in years. The MSCI All Country World Index ex-U.S. gained more than 30%, outperforming U.S. benchmarks. European and Asian markets benefited from a weaker dollar, improving inflation metrics, and easier monetary conditions. Japanese stocks were among the top performers, while those in China lagged due to ongoing weakness in the property sector and capital outflows. That outperformance by International and Emerging Markets will likely reverse in the coming year as economic growth slows in those economies and the US Dollar rallies.
The big story in 2025 was in the metals complex. Gold surged more than 70%, breaking through $4,500 per ounce by year-end, while Silver gained more than 140%, outpacing equities, bonds, and even most cryptocurrencies. Investors moved into metals as speculation and leverage increased sharply. While narratives abounded, the reality is that price chasing, leverage, and options created an excess level of demand. 2026 could see a sharp reversal if inflation continues to decline and margin requirements are increased further. The bond market also finished the year with modest positive returns, driven by falling yields late in the year as credit spreads remained stable, and investment-grade bonds benefited from stronger demand into December.
Commodities outside of metals underperformed. Oil traded flat to lower for the year, weighed down by slowing global demand and higher-than-expected supply. Cryptocurrencies experienced a volatile yet underwhelming year, with Bitcoin trading sideways for most of 2025.
Overall, 2025 was a year of resilience across financial markets. Despite early concerns about inflation, rate hikes, and geopolitical tension, risk assets delivered substantial gains. Market leadership shifted late in the year as falling yields boosted equity valuations and investor positioning turned more bullish. If inflation continues to moderate and the Fed follows through with rate cuts, the setup for early 2026 remains constructive.
Which brings us to the market.
Technical Backdrop – Santa Rally Fails.
The final trading week of 2025 closed with the S&P 500 at 6,858.47 on Friday, January 2, 2026. Despite substantial annual gains, the index ended the week modestly lower, losing momentum into year-end. The decline broke a three-week advance as the “Santa Claus Rally” failed to materialize.
The Santa Claus Rally, traditionally measured as the final five trading days of December and the first two of January, often serves as a short-term sentiment gauge. Historically, when this period posts gains, the S&P 500 finishes the following year higher roughly 75 percent of the time. When it fails, forward returns tend to weaken. For 2025, the rally did not arrive, with the S&P 500 slipping nearly 0.8% over the seven-session window; however, that did not deter the substantial gains for last year.
From a technical standpoint, the index remains firmly above its long-term trend lines, though short-term signals turned neutral. The 20-day moving average sits at 6856.67, just below Friday’s close, as the market bounced off that support on Friday. The 50-day moving average, near 6,805.01, marks the next layer of trend support, while the 200-day average remains far below at 6,292.67. The weakness into year-end triggered a short-term momentum sell signal, which may pressure stocks somewhat next week. Furthermore, the 14-day RSI, hovering near 52, has also weakened and remains in a negative divergence to the market.
(Click on image to enlarge)

Trading volume into year-end was thin, typical for the holiday period, but breadth readings narrowed. Mega-cap technology and communication services names held up better than cyclicals, while energy and small-caps lagged. Analysts at LPL Financial and Carson Investment Research both noted that the lack of a year-end push suggests a more selective market entering 2026, which won’t be much different than 2025; however, their interpretation aligns with prior historical patterns, where failed Santa rallies have preceded higher volatility in Q1 rather than immediate trend reversals. Additionally, with the market posting gains over the last eight consecutive months, a down month is becoming increasingly likely.
Overall, the market continues to consolidate the massive gain from the April lows. The 6,900 level has acted as a ceiling since mid-December, capping attempts to push higher, while buyers have consistently stepped in near 6,800. A decisive breakout above 6,900 would reassert bullish control and pave the way for targets of 7,000 and 7,200. Conversely, a close below 6,800 could signal a test of the 6,700 region, which coincides with the December swing lows and the rising 100-day moving average.
Despite the mild weakness, the broader market structure remains constructive. The index continues to respect key support, volatility remains contained, and investor sentiment, while tempered, is far from fearful. If early-2026 data confirm easing inflation and steady earnings, the failed Santa rally may end up being a brief pause before another leg higher. If not, the pattern could mark a short-term top after an exceptional 2025 advance.
SUPPORT AND RESISTANCE, S&P 500
| Level Type | Price | Technical Significance |
|---|---|---|
| Resistance 3 | 7,200 | Target level if markets can break above previous all-time highs. |
| Resistance 2 | 7,000 | Major psychological level; first upside test following breakout.. |
| Resistance 1 | 6,920 | Major psychological level. Previous intraday all-time high. |
| Pivot / Close | 6,858.47 | Friday, January 2, 2026, close. |
| Support 1 | 6,856.67 | 20-day moving average; intraday pivot range. |
| Support 2 | 6,805.01 | 50-day moving average; key trendline support. |
| Support 3 | 6,720 | December swing low area; likely strong demand zone. |
| Support 4 | 6,292.67 | 200-day moving average; long-term trend floor. |
Key Catalysts Next Week
Traders and strategists enter the first whole trading week of 2026 with a heightened focus on early signals for economic momentum, labor market strength, and inflation, all of which will shape expectations for Federal Reserve policy. The week’s slate of macro releases and earnings cues offers the first real data points after the year-end holiday doldrums. Markets finished 2025 near historical highs, but a late-December pullback and a failed “Santa Claus Rally” heightened sensitivity to fresh data in early January.
Economic and survey indicators will influence traders’ perceptions of growth and the Fed’s policy path. The ISM Manufacturing Index, released on Monday, offers insight into the pace of factory activity following a strong but uneven demand environment in late 2025. On Wednesday, the ADP employment report and ISM Non-Manufacturing Composite together will provide a mid-month check on labor market resilience and service sector momentum, two key pieces for the Fed’s data-dependent framework. By Friday’s Employment Situation for December, markets will receive the broader jobs picture for the first time in 2026, bridging the late-2025 payroll release gap caused by holiday scheduling.
International data will also be monitored. The Eurozone CPI on Wednesday provides a snapshot of inflation trends abroad, which is relevant for currency flows and global risk appetite. Meanwhile, the U.S. Trade Balance and productivity releases on Thursday round out the week’s macroeconomic data. Markets will further parse early corporate earnings whispers and any Fed speaker commentary for clues on how firms and policymakers view the evolving economic landscape.
(Click on image to enlarge)

Market Outlook For 2026
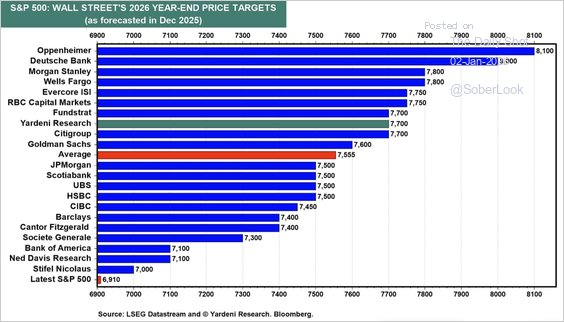
Wall Street’s market outlook enters 2026 in a bullish mood, albeit with nuance. After three consecutive years of substantial gains in major indexes, many strategists expect the U.S. stock market to extend its rally into another year, with the central Wall Street banks highlighting several drivers supporting continued upside, from increases in productivity due to AI to the tax cuts and deregulation from the OBBBA.
Goldman Sachs, for example, forecasts that S&P 500 earnings per share will accelerate in 2026, rising approximately 12 percent from 2025 levels. This earnings momentum underpins the constructive view on equities, and they see opportunities not just in prominent technology names, but also across cyclical sectors such as small caps, non-residential construction, and consumer stocks exposed to the middle-income consumer.
Furthermore, global growth is expected to stay sturdy in 2026. Goldman Sachs projects 2.8 percent global GDP growth, up from consensus expectations, with the U.S. economy outpacing most major peers. China’s growth is also forecast to improve, broadening the backdrop for global stock demand.
Morgan Stanley echoes a positive but tempered outlook, suggesting that U.S. equities will outperform global peers, a reversal from last year, with the S&P 500 projected to rise to about 7,800.
Regardless of the firm, several key structural factors universally support their bullish outlook:
- Monetary policy is expected to remain supportive. The Federal Reserve has already enacted rate cuts in 2025, and further moderation in borrowing costs could preserve liquidity and investment demand. Historical data indicate that positive equity returns occur when rate cuts coincide with established bull markets.
- Earnings growth is forecast to remain robust. Beyond headline numbers, broad sectors could benefit from technological adoption and operational leverage as companies expand margins.
- Sector breadth may improve. After several years of narrow leadership dominated by mega‑cap tech, strategists see room for cyclicals, financials, and industrials to play a larger role in 2026 performance.
This combination drives the bullish premise: 2026 will not just be about extending the past year’s returns, but consolidating gains across more parts of the market. That view is supported by the earnings expectations for this year, with the Magnificent 7 growth rates slowing but the bottom 493 surging.

So, with such a bullish market outlook, what is there to worry about?
The Bearish Counterpoint: What Could Go Wrong?
Despite the bullish narrative, a thoughtful case against unbridled optimism exists. Unlike the simple bull versus bear dichotomy, credible risks could significantly dampen or reverse the more bullish market outlooks.
First, we would be remiss not to mention valuations. Forward valuations are elevated, and while they are terrible market timing devices, they do represent investor sentiment, which is universally bullish. This means the market’s upside is more sensitive to disappointments in earnings or macro trends. If earnings growth does not materialize as expected, stocks may struggle, even in a benign macro setting. We discussed this recently, in “Risks To Market Outlooks.“
“Notably, these forecasts rest on an assumption that the economy will not only avoid recession but reaccelerate in the face of waning inflation. As noted, equity markets have responded by pushing valuations higher across major indexes, with price-to-earnings ratios well above historical medians. Simultaneously, investors have rewarded narratives built on the idea of a soft landing and a return to pre-pandemic trends.”

“However, this narrative appears to overlook the trends in recent economic data. Inflation expectations have moderated, not because of increased demand, but due to weaker consumption and cooling labor dynamics. As recent economic data indicate, disinflation has accompanied slower GDP growth and a decline in personal consumption momentum. If the economy were indeed set to reaccelerate, these trends should be increasing rather than returning to historical averages.”
(Click on image to enlarge)
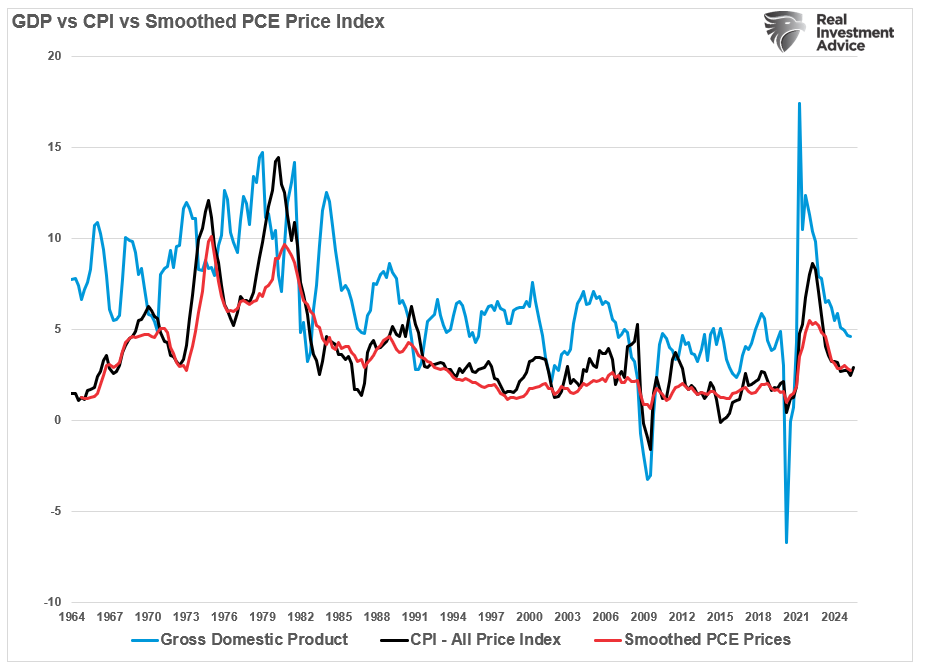
Secondly, the market is pricing a “soft landing” where inflation cools, growth persists, and rate cuts continue. Yet, that outcome would be historically rare. When inflation falls this quickly, it typically reflects a slowdown in demand rather than policy success. Additionally, the strong relationship between economic growth and earnings should not be dismissed. That disconnect exposes investors to market risk if growth does not materialize as expected and valuations are reconsidered.
Furthermore, if inflation stubbornly remains above targets or the labor market shows uneven data, the Federal Reserve might delay or reduce the magnitude of rate cuts. A less accommodative stance could tighten financial conditions and pressure asset prices as market outlooks reverse.
Third, earnings growth estimates are very optimistic. As we head into 2026, strategists are hopeful that the bottom 493 stocks will begin to grow earnings aggressively. As noted previously:
“Wall Street currently expects the bottom 493 stocks to contribute more to earnings in 2026 than they have in the past 3 years. This is notable in that, over the past three years, the average growth rate for the bottom 493 stocks was less than 3%. Yet over the next 2 years, that earnings growth is expected to average above 11%. (See chart above)
“Furthermore, the outlook is even more exuberant for the most economically sensitive stocks. Small and mid-cap companies struggled to produce earnings growth during the previous three years of robust economic growth, driven by monetary and fiscal stimulus. However, next year, even if the Fed’s soft landing narrative is valid, they are expected to see a surge in earnings growth rates of nearly 60%.”
There is nothing wrong with having an optimistic market outlook when it comes to investing; however, “outlooks can change rapidly,” which is a significant market risk, particularly when expectations and valuations are elevated.
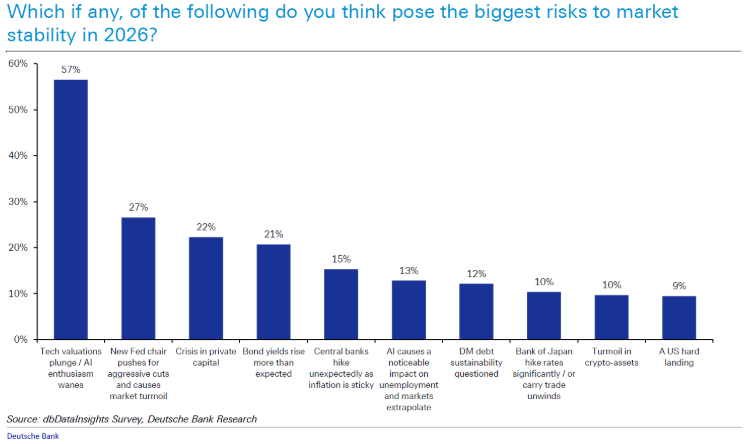
Third, geopolitical and global trade pressures persist as a threat to more bullish market outlooks. Trade friction, geopolitical tension, or currency instability all contribute to sudden shifts in risk tolerance. Recent fund manager surveys identify AI valuation bubbles, bond market turbulence, inflation resurgence, credit stresses, and trade escalations as top concerns.
Which one will it be that “derails the apple cart?”
The most likely answer is that it will be none of them. This is because when investors are monitoring some risk, they make portfolio changes to hedge against that risk. Therefore, that “risk” becomes priced into the market. Most likely, the risk that eventually manifests itself will be something that no one is expecting. That “surprise” is what causes markets to buckle. Consider Trump’s tariff announcement last March; investors had to materially reprice the markets for a rapid change in forward expectations of earnings.
Finally, investors have become extremely complacent about above-average returns. Take a look at the total annual returns of the market since 2019.
- 2019 +31.2%
- 2020 +18.0%
- 2021 +28.5%
- 2022 -18.0%
- 2023 +26.1%
- 2024 +24.9%
- 2025 +17.8%
While those returns have been very healthy, they are detached from the underlying drivers of economic growth, which is why valuations have risen so much in recent years.
With analysts’ market outlooks based on strong revenue growth and margin expansion, several factors could derail the markets. As is always the case, a market priced for perfection leaves little room for earnings misses or growth shocks. If reality falls short of those optimistic assumptions, market risk could rise abruptly.
How to Navigate Markets in 2026
Critical Note: Market outlooks are a “best guess,“ but Wall Street is always incentivized to be optimistic, as that is what drives product sales. Think about it. If Wall Street said, “2026 is likely going to be a negative year,” what would you likely do? Would you be buying or selling whatever ETF, IPO, or other Wall Street offering? More notably, the market outlooks and the potential risks to those outlooks are not guaranteed. Could 2026 be another bullish year? Absolutely. However, there is a risk it could be bearish. Therefore, investors should recognize that a combination of valuation risk, macro uncertainty, and narrow leadership could disrupt forward returns unexpectedly.
With both bulls and bears offering credible arguments, a disciplined approach to investing in 2026 is essential.
- Moderate Return Expectations: Accept that high valuations compress future returns. Even in a bullish scenario, forward returns may fall short of recent past performance. Forecasts that assume double-digit gains are optimistic; more moderate gains or sideways markets should be considered as part of the planning process.
- Diversify Strategically: Diversification remains a foundational risk management tool. While U.S. large caps may offer gains, broadening exposure to international equities, small caps, and select global sectors can protect against concentrated drawdowns.
- Focus on Fundamentals: Earnings growth, strong balance sheets, and pricing power matter. Stocks with sound fundamentals are more likely to withstand volatility if macroeconomic headwinds intensify.
- Watch Macro Triggers: Inflation prints, Fed guidance, and employment reports will continue to drive short‑term risks. Investors should adjust their exposure in response to shifting macroeconomic trends rather than adhering rigidly to static allocations.
- Risk Management is Essential: In a higher‑volatility environment, risk tools such as hedging or dynamic allocation shifts should be considered for those with shorter investment horizons or higher sensitivity to market swings.
- Beware Sector Bubbles: AI and tech remain powerful trends, but speculative excess is a real risk. Investors should differentiate between firms with scalable earnings and those that trade on hype.
As 2026 begins, investors should maintain a bullish stance as there is no evidence of rising market or credit-related risk. However, with elevated valuations, macro fragility, and concentrated market leadership, it means that risks are real and present.
Investors should navigate 2026 with balanced expectations, diversified holdings, and a disciplined focus on risk management. Markets may still rise, but returns will likely come with volatility and require thoughtful engagement rather than passive optimism.
Market Statistics & Analysis
Weekly technical overview across key sectors, risk indicators, and market internals
Market & Sector X-Ray: Pullback To Support
For the most part, we started 2026 with mild gains, with Energy, Materials, Industrials, and International markets leading the way.
(Click on image to enlarge)

Technical Composite: 72.28 – Conditions Weaken Slightly
The overall technical condition remains bullish, but has weakened slightly over the last month. After hitting more extreme overbought conditions heading into October, the market has continued to consolidate, working off some of that state. While not bearish, some further weakness early next week would be unsurprising, providing a better entry point for a rally at some point.
(Click on image to enlarge)

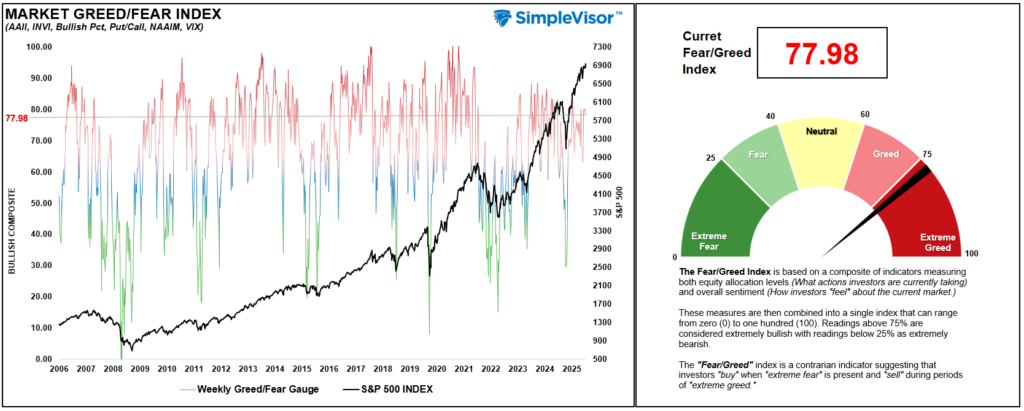
Fear/Greed Index: 77.98 – Extreme Greed Weakens Slightly
Positioning in equities remained strong this week as the market rallied on Friday. Despite the recent correction, investors remain very bullish with allocations to equities at very elevated levels. Some consolidation or weakness heading into the New Year would be unsurprising, but not necessary.
(Click on image to enlarge)
Relative Sector Performance
The entire market has shifted slowly from overbought levels to neutral over the last week. However, Communications and Technology are still slightly overbought, while Staples and Utilities are the most oversold. A rotation into defense would be unsurprising if the market weakens at the beginning of the year.
(Click on image to enlarge)

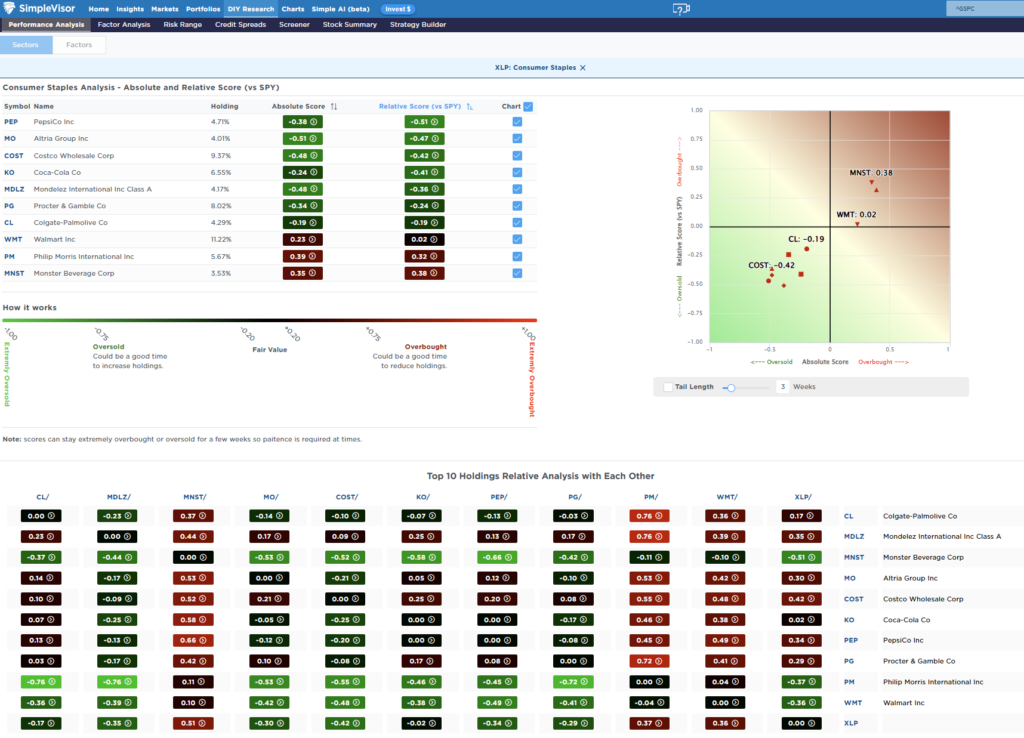
Most Oversold Sector Holdings
As noted above, the most oversold sector is Staples. PEP and MO are currently the most out-of-favor, with COST and KO close behind. The best performing staple companies remain WMT, PM, and MNST.
(Click on image to enlarge)
Sector Model & Risk Ranges
The risk range report has reset for the New Year, so there isn’t enough usable data until next week. However, the market remains bullish, suggesting that investors remain long equities for now.
(Click on image to enlarge)

Have a great week.
More By This Author:
Nvidia’s Cash Strategy Reflects Regulatory Landscape
YTD Returns Highlight A Narrow Market
Electricity Prices Could Become A Structural Inflation Problem
Disclaimer: Click here to read the full disclaimer.


