
Market Ignored War Headlines - Are We Headed For A Blow-Off Top?

Image Source: Unsplash
Despite rising geopolitical tensions between Israel and Iran, the market showed surprising strength. A major volume spike on Friday might be the clue smart money is leaving behind — but is it bullish confirmation or a setup for a trap?
Watch the video from the WLGC session on 17 Jun 2025 to find out the following:
- Is the recent price breakout a genuine sign of strength — or a trap before a selloff?
- What does Friday’s unusual volume spike really reveal about market sentiment?
- Which key support and resistance levels should retail traders watch right now?
- And a lot more…
Video Length: 00:03:29
Buyers Continue to Buy the Dip
Despite rising geopolitical tensions between Israel and Iran, we’re still seeing strong demand in the market. There was a significant volume spike on Friday, June 13—a clear sign that buyers are eager to scoop up stocks when prices dip. Even though there were attempts to push prices lower, buyers stepped in, keeping the market buoyant.
Eye on Consolidation & Support
The highlighted a recent consolidation area. As long as the S&P 500 doesn’t break below this, there’s a good chance the market might test and even surpass its previous all-time highs.
The key minor support levels are around 5,860 and 6,000. A more meaningful support zone sits at approximately 5,700, where a previous gap could offer stability if the market does pull back.
Resistance Ahead: What to Watch
With the S&P printing new highs and just 100 points shy of its all-time record, the next move is critical. Resistance often leads investors and traders to take some profits—so don’t be surprised by a brief pullback.
Pay close attention to how the market reacts at the highs, especially as major catalysts (like news out of the Middle East, U.S. tariff policy, and potential Fed updates from Powell) can shake things up quickly.
What to Avoid
Be wary if you see a sudden spike in supply (selling) at the top, as it could signal more significant profit-taking and a larger retracement in the cards.
Market Environment
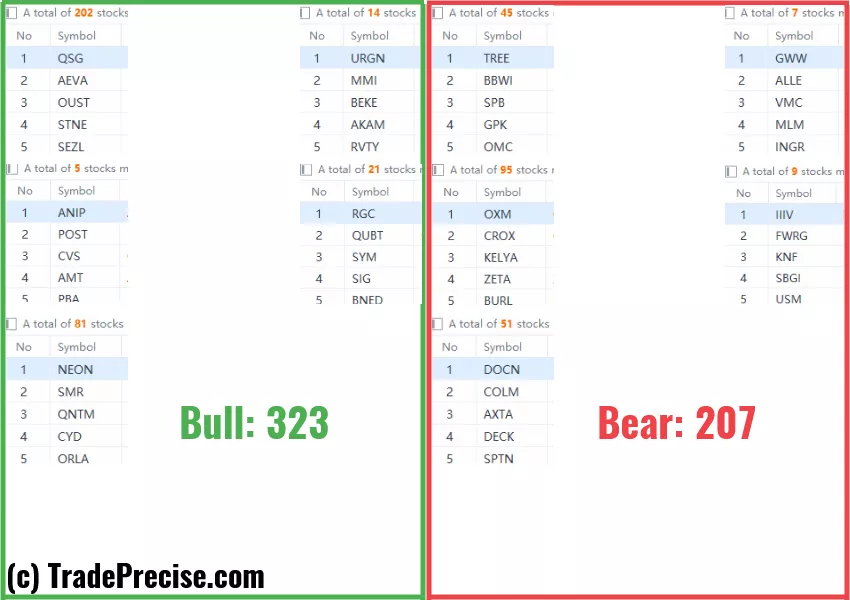
The bullish vs. bearish setup is 323 to 207 from the screenshot of my stock screener below.
(Click on image to enlarge)
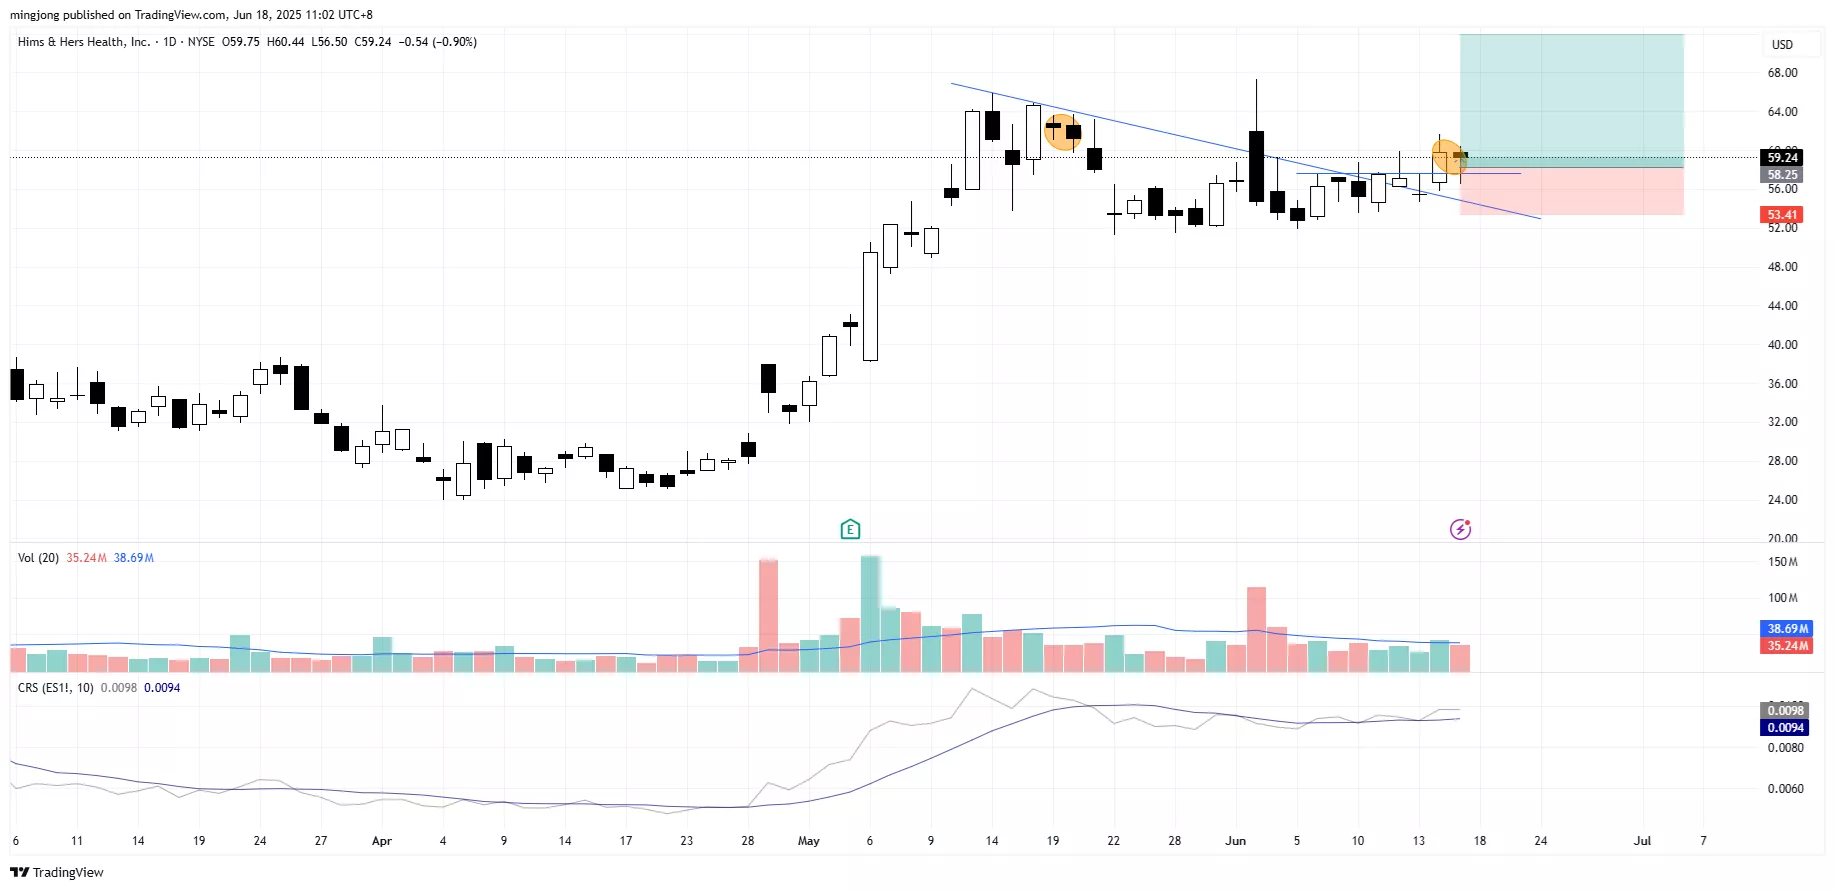
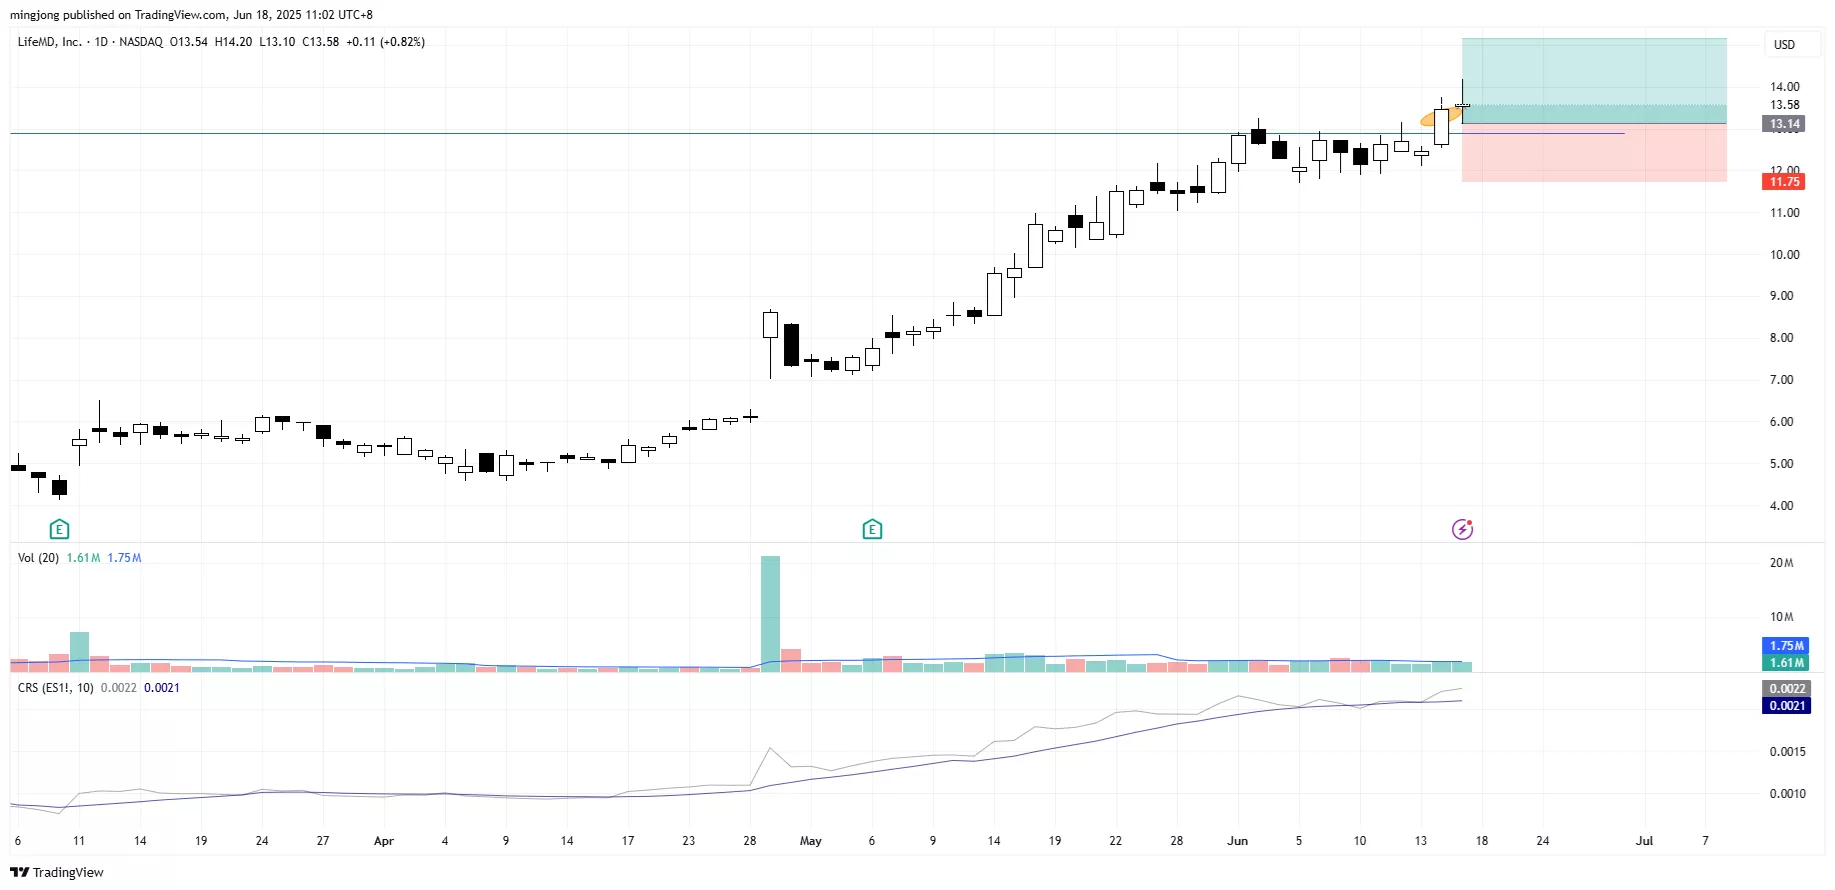
22 actionable setups such as CRWV, HIMS, LFMD were discussed during the live session on 11 Jun 2025 before the market open (BMO).
(Click on image to enlarge)

(Click on image to enlarge)
(Click on image to enlarge)
More By This Author:
3 Clues The S&P 500 Is Warming Up For A Breakout
Rejection, Recoil… And Ready To Rip? Is A Massive Breakout About To Hit?
This Chart Pattern Just Flashed A Hidden Demand Signal - Is The Market Ready To Rip Higher?
Disclaimer: The information in this presentation is solely for educational purpose and should not be taken as investment advice.


