
This Chart Pattern Just Flashed A Hidden Demand Signal - Is The Market Ready To Rip Higher?

Image Source: Pexels
Watch the video from the WLGC session on 27 May 2025 to find out the following:
- What does the hidden demand on Thursday and Friday really tell us about market direction?
- Why is the gap-up bar (on 12 May 2025) so critical — and what happens if it holds??
- What clues is volume giving us right now — and how should we trade it?
- And a lot more…
Video Length: 00:05:09
Market Environment
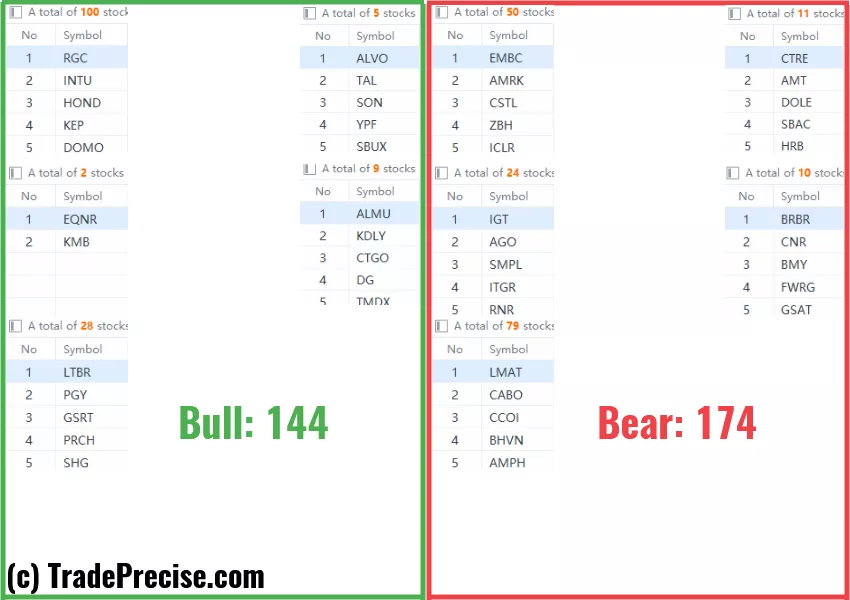
The bullish vs. bearish setup is 352 to 73 from the screenshot of my stock screener below.
(Click on image to enlarge)
3 Stocks Ready To Soar
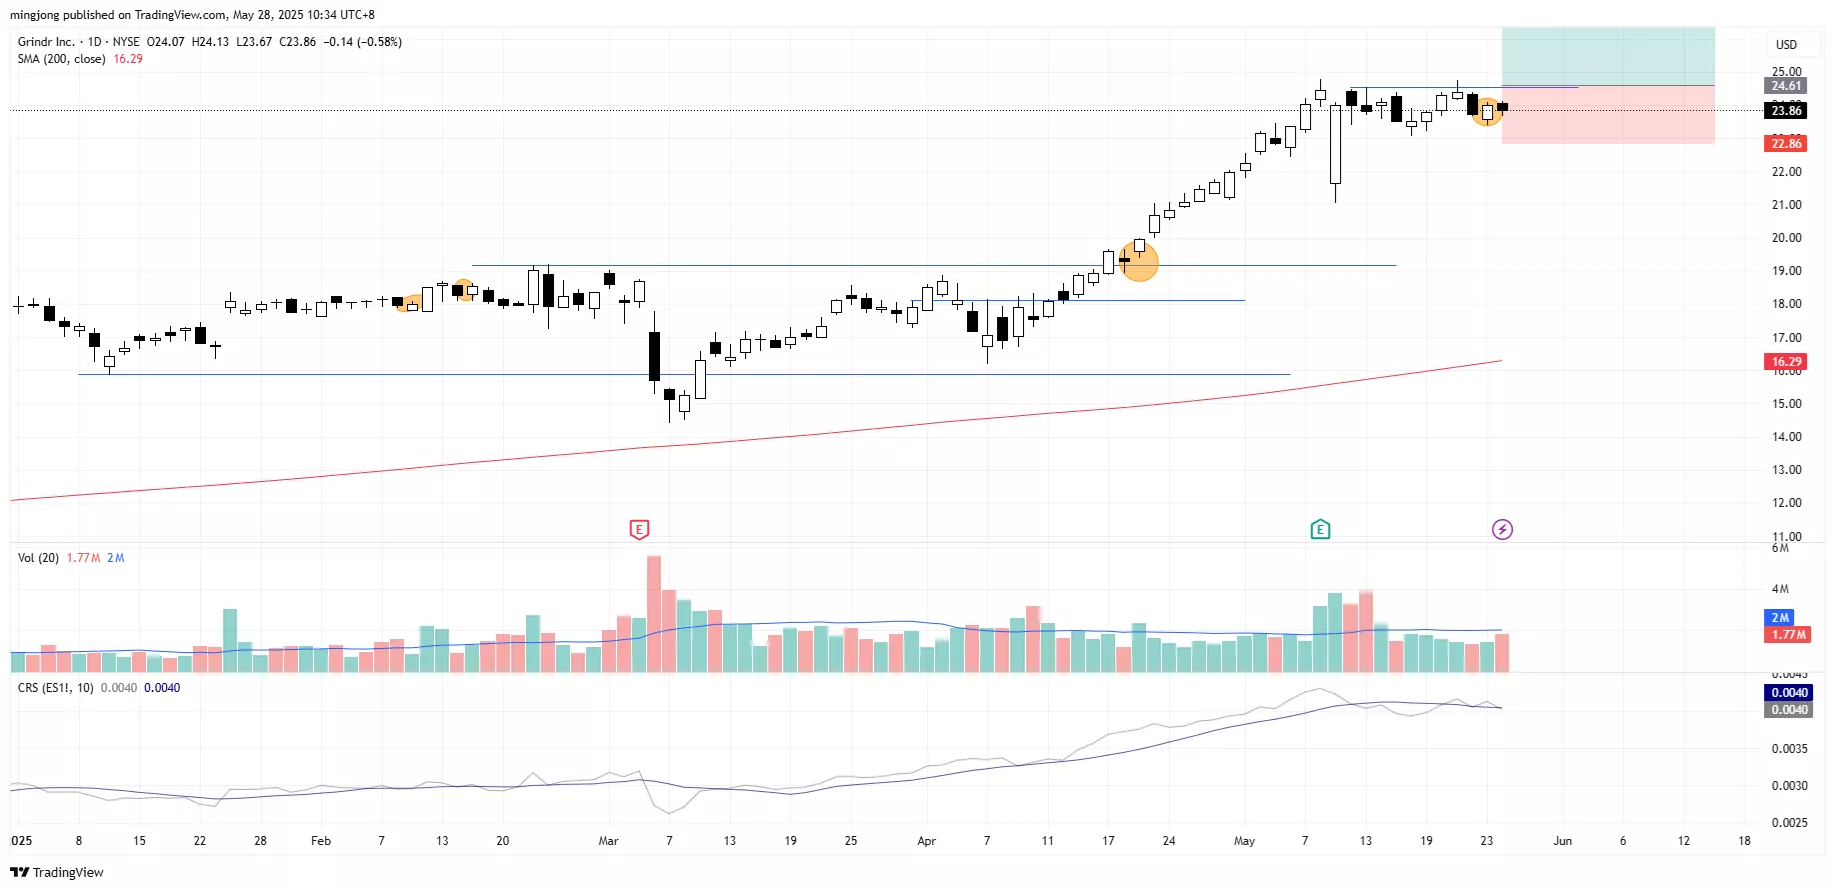
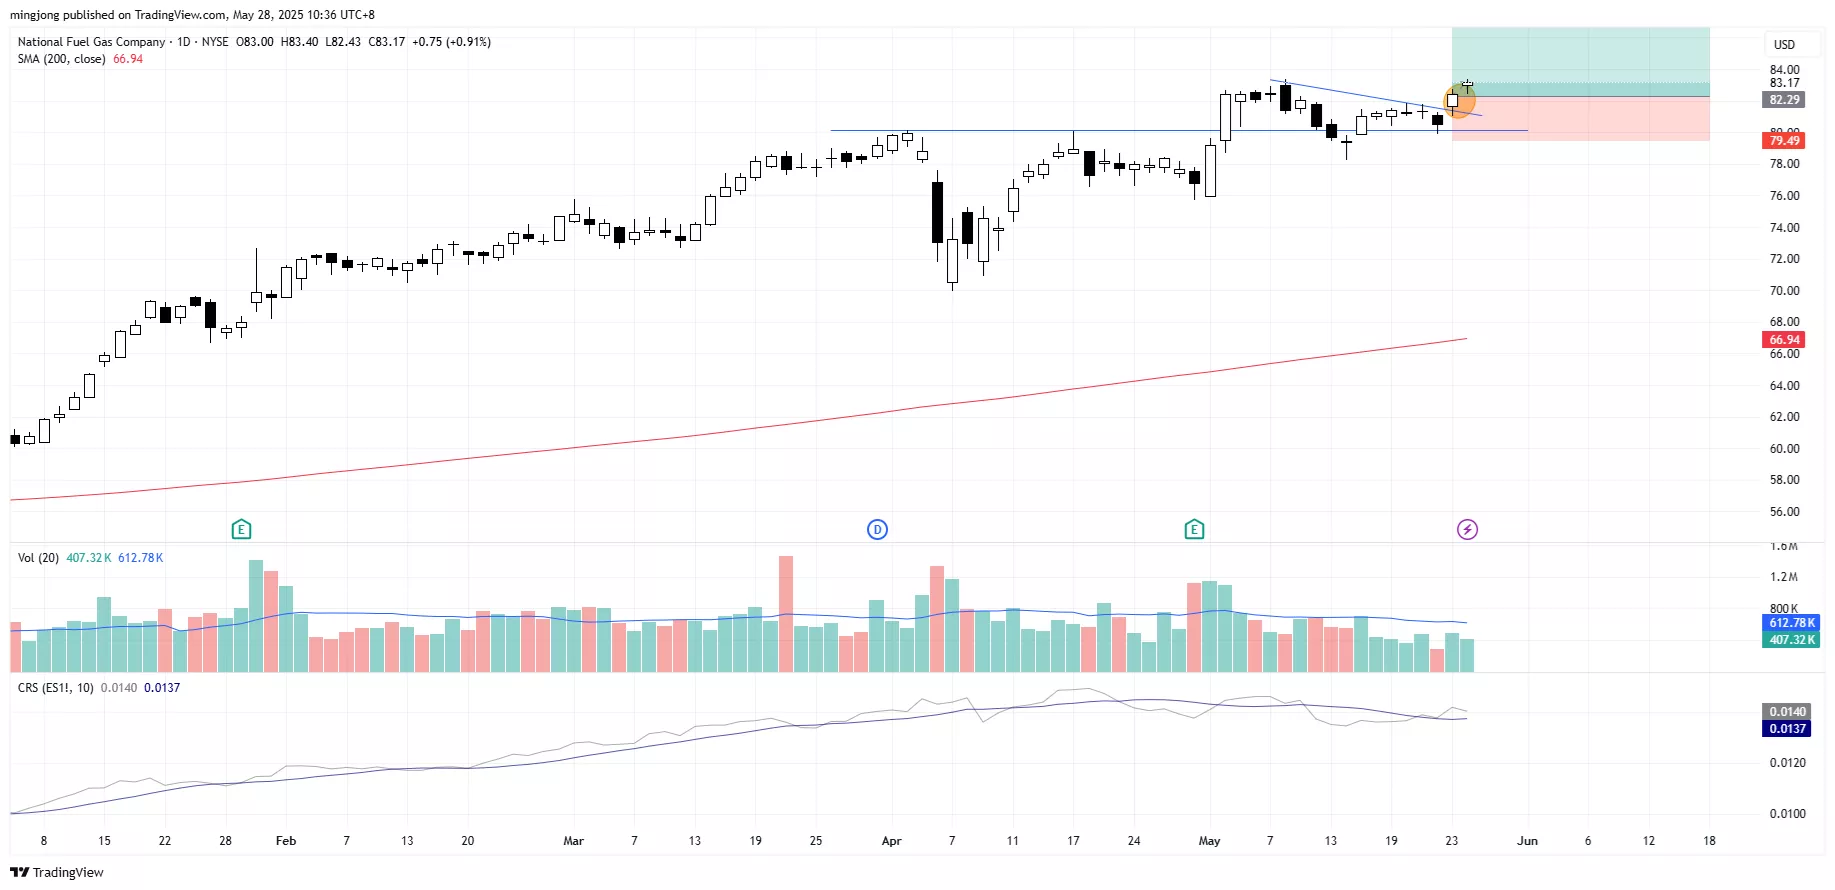
26 actionable setups such as GRND, SERV, NFG were discussed during the live session on 27 May 2025 before the market open (BMO).
(Click on image to enlarge)
(Click on image to enlarge)

(Click on image to enlarge)
More By This Author:
This Support Zone Could Be The Launchpad For New Highs — Are You Watching It?
No Red Flags Yet... But Here’s What Needs To Hold For The Bull Case To Stay Alive
Pullback Coming? This Axis Line Could Be The Launching Pad
Disclaimer: The information in this presentation is solely for educational purpose and should not be taken as investment advice.


